Peak map
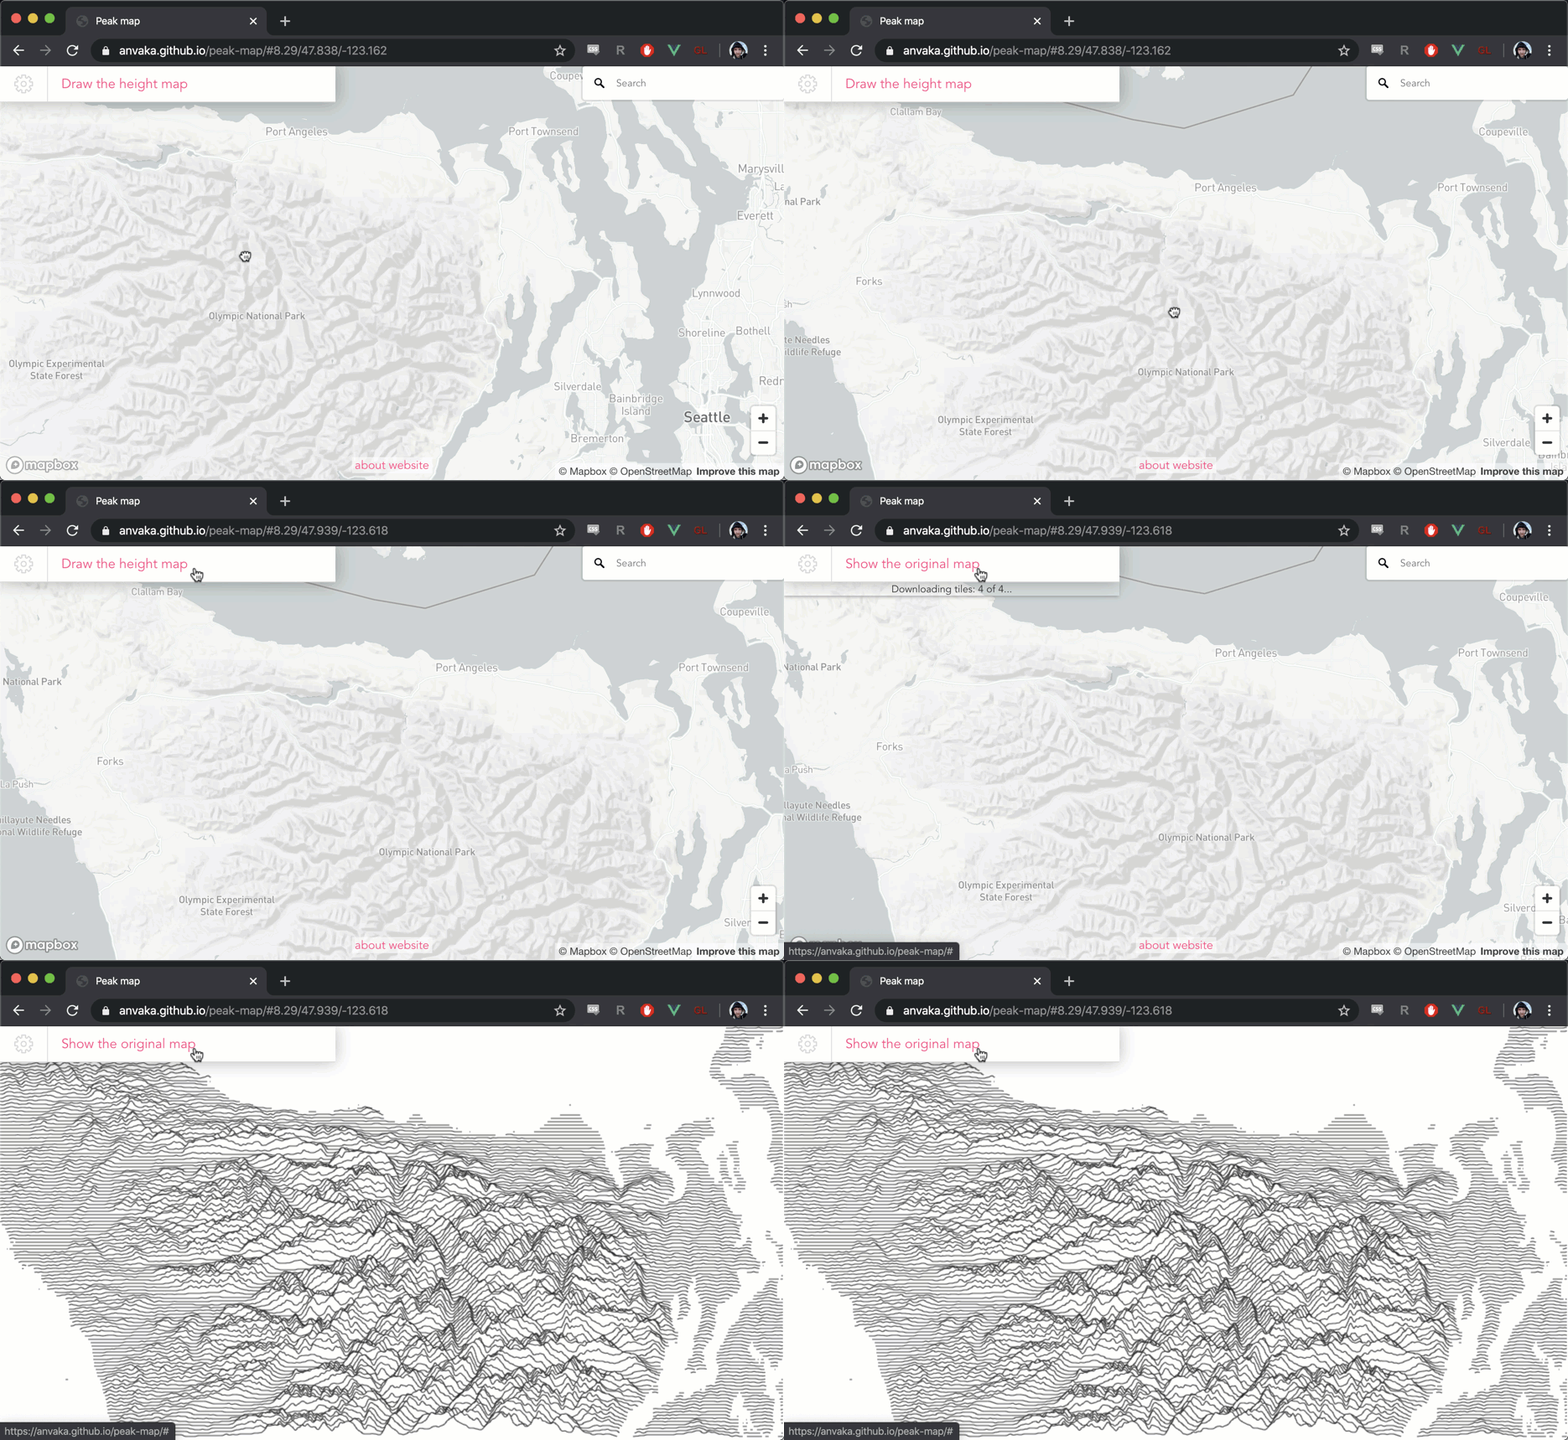
This website allows you to visualize elevation of any area on the map with
filled area charts (also known as a joy plot):
How?
I'm using MapBox GL to draw the map. Once the area is selected, I'm using elevation data API from the MapBox.
The rendering of the lines is done on canvas overlay, using regular 2D canvas context.
Bonus
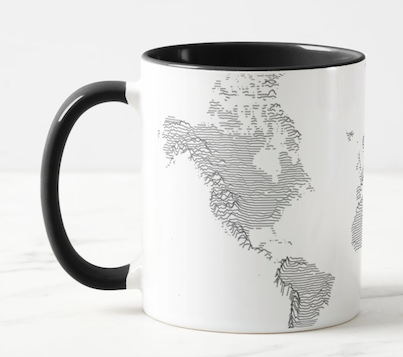
You can print the final map onto a mug if you like the result:

