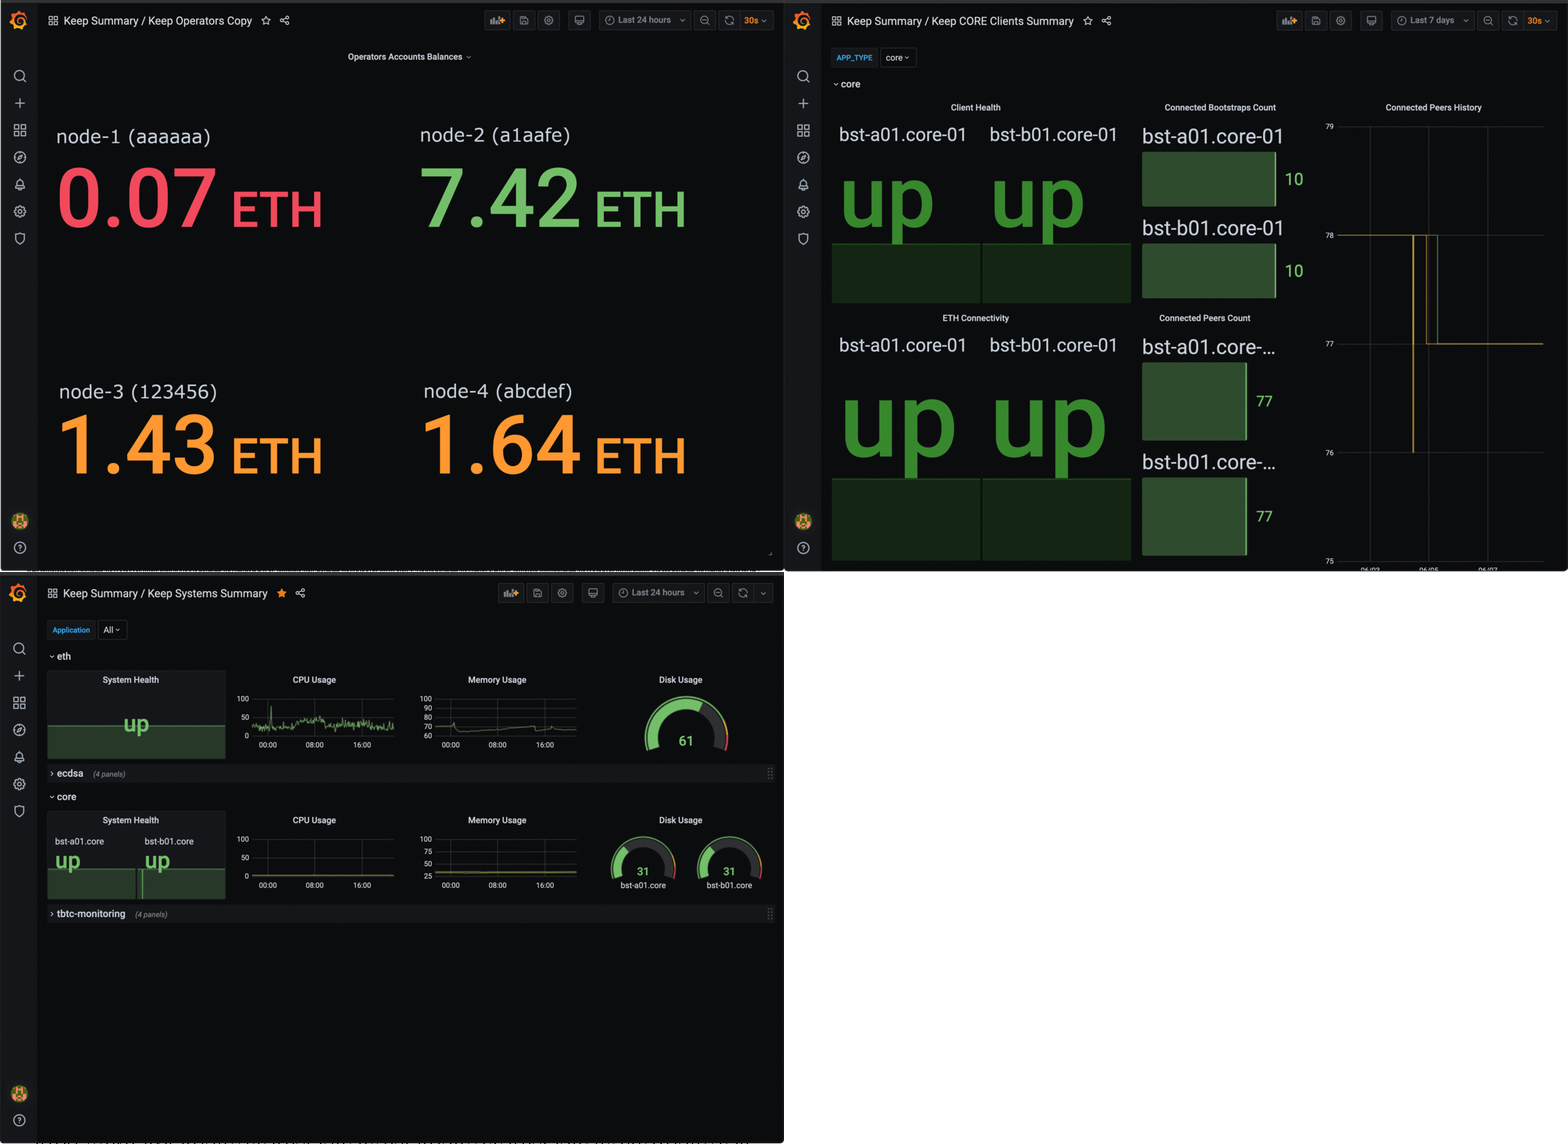
This repository contains tools for monitoring keep-core and keep-ecdsa clients of Keep Network.
This is a complete solution for real-time health monitoring of Keep clients and systems they are running on, including client and system-level alerts pushed to Opsgenie mobile client of an on-call engineer, Ethereum connectivity health checks, and operator account balances monitoring.
|
❗
|
This repository does not contain any tools for key shares backups, operator key backups, secure access to them, cluster relocation, and other infrastructure-level features that should be supported by a production-grade deployment. |
The tools support monitoring of:
-
Keep Network clients, including metrics exposed by the client and client logs,
-
host machines the clients are working on,
-
ethereum accounts balances for Keep Network operators.
The configuration includes pre-defined sets of Dashboards and Alerts.
To install the monitoring system first clone this repository on your machine:
git clone git@github.com:boar-network/keep-monitoring.gitThen, install Docker and Docker Compose and run:
docker-compose upContainers named prometheus and grafana will be up and running.
The Grafana dashboard will be accessible on port 8080 (http://localhost:8080/).
Use admin/admin credentials when signing in for the first time.
For guidance on setting up nodes to be monitored see Monitoring Targets section.
To add monitoring targets you should first configure target endpoints and add them to the monitoring system.
Several types of target endpoints can be handled by the monitoring system:
To expose client-level metrics endpoint of keep-core or keep-ecdsa clients
just make sure the Metrics.Port config property is set for each of them.
Everything else works out of the box.
For further details, here is the list of of references describing Keep clients monitoring and diagnostics:
Exposing system-level metrics is a little bit harder as it depends on the platform.
For *NIX systems you should use the Node Exporter tool. Installation instructions are described here.
You can also use the predefined Ansible playbook to install the node exporter
automatically on the target machine and expose it on port 9602 by running:
ansible-playbook -i <user>@<machine>, -e "ansible_port=<ssh_port>" ./ansible-playbooks/linux-node-exporter.ymlEthereum accounts monitoring requires connection to Ethereum API. This can be Geth, Alchemy, Infura or any other service.
Configure GETH variable with URL to the Ethereum API in ./balance-exporter/variables.env file.
(Sample file)
Adding new monitoring targets depends on their type:
-
Client-level metrics endpoint
Add the new endpoint address to the
targetsarray of the ./prometheus/clients-targets.json file. -
System-level metrics endpoint
Add the new endpoint address to the
targetsarray of the ./prometheus/systems-targets.json file. -
Account balance
Add the new account’s address to
./balance-exporter/addresses.txtfile. Use thename:addressformat wherenameis an arbitrary value. In the case of multiple accounts, put them in separate lines. (Sample file)
Prometheus will refresh automatically and you should see the new target in the dashboard after a while.
Alerts are emitted to the receivers configured in ./alertmanager/alertmanager.yml.
To use Slack notifications, two properties should be set in the
./alertmanager/alertmanager.yml config file:
-
receivers.slack_configs.api_url: should contain an URL of the Slack incoming webhook. -
receivers.slack_configs.channel: must be set to the same channel as defined in the webhook configuration.
To use Opsgenie notifications, three properties should be set in the
./alertmanager/alertmanager.yml config file:
-
receivers.opsgenie_configs.api_key: should contain API key of the Opsgenie API integration -
receivers.opsgenie_configs.api_url: should be set to the correct value depending on the chosen data center region -
receivers.opsgenie_configs.responders: should point to the desired alert responders configured in Opsgenie
Installed Prometheus instance contains several predefined alerts corresponding to the predefined Grafana dashboards. Those alerts are defined in ./prometheus/alert-rules.yml file.
Rules reconfiguration requires Prometheus container restart.
Alerts corresponding to the clients:
-
ClientDown: fired when a client goes down -
EthConnectivityDown: fired when a connection with the ethereum node is down -
LowConnectedPeersCount: fired when connected peers count falls below5 -
LowConnectedBootstrapCount: fired when connected bootstrap count falls below2
Alerts corresponding to the systems:
-
SystemDown: fired when a system goes down -
HighCpuUsage: fired when system CPU usage goes above90% -
HighMemoryUsage: fired when system memory usage goes above90% -
HighDiskSpaceUsage: fired when system disk space usage goes above90%
Alerts corresponding to the ethereum account balances:
-
LowAccountBalance: fired when given account’s balance falls below1 ETH
Installed Grafana instance contains few predefined dashboards:
-
Keep Balances: contains balances of monitored operators ethereum accounts, -
Keep Clients: contains client-level metrics such asconnected_peers_countand similar. You can change the observed client using theclientdropdown in the top left corner, -
Keep Systems: contains system-level metrics such as CPU and memory usage. You can change the observed system using thesystemdropdown in the top left corner.
There are also Summary dashboards available, aggregating metrics for all the configured nodes.
A bundled solution for logs monitoring is currently under development. For the time being you should configure a log exporter and aggregator of your choice to gather the logs and define alerting rules.
One of the possible solutions is using Logz.io.
|
💡
|
To make the Keep client log to a file configure GOLOG_FILE environment variable
with a path to a file, e.g. GOLOG_FILE=/var/log/keep/client.log.
|
The logs should be delivered to the Logz.io’s endpoint using one of the supported shipping solutions, e.g. (Filebeat).
Once the logs are delivered to Logz.io you should define a log parsing rule.
This can be done in Tools → Data Parsing (see: documentation).
A patter you can use for parsing the log messages:
"^%{TIMESTAMP_ISO8601:timestamp}\\s+%{LOGLEVEL:level}\\s+%{DATA:module}\\s+%{GREEDYDATA:message}"In case of any problems feel free to contact Logz.io Support team via chat and send them sample parsing configuration shared in the .logs/config/logzio-keep-parsing.json file.
After the logs are parsed correctly you can start configuring Alerts. We recommend you create:
-
severeseverity alerts for anyCRITICAL,DPANIC,PANICorFATALlevel messages, -
highseverity alerts for anyERRORlevel messages, -
mediumseverity alerts forWARNlevel messages.
You can use many popular notification endpoints including Slack, Opsgenie or PagerDuty.
Tools developed by the Boar Network 🐗 team with great contributions from lukasz-zimnoch, nkuba, and pdyraga.


