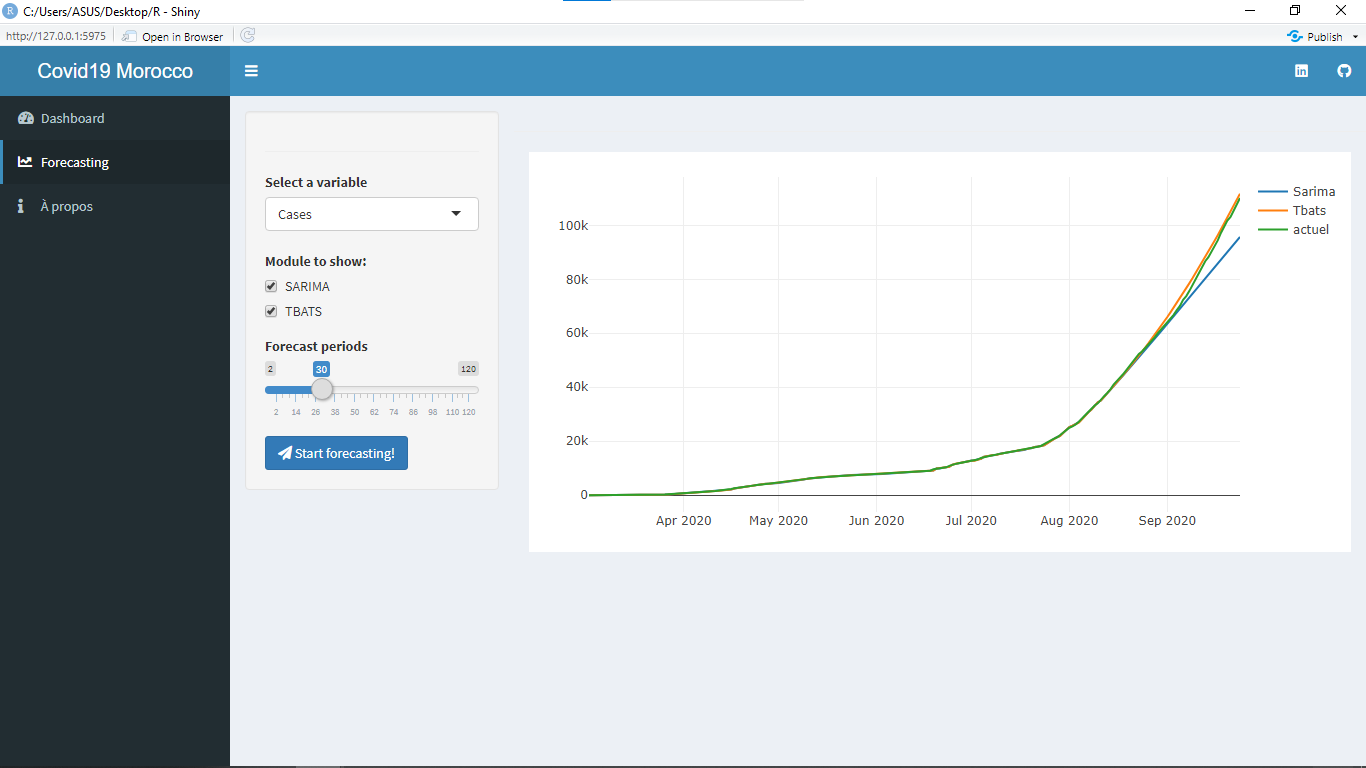
Application for real-time visualization and forecasting of COVID-19, data on the number of patients diagnosed, the number of patients who died and the number of patients cured. These figures are based on information from the Geomatic API, Morocco.
Visualization of covide-19
Forecasting of covide-19 with TBASTS and SARIMA
This window show information about application
Linkedin: aghezzafmohamed
Gmail: aghe.mohamed@gmail.com


