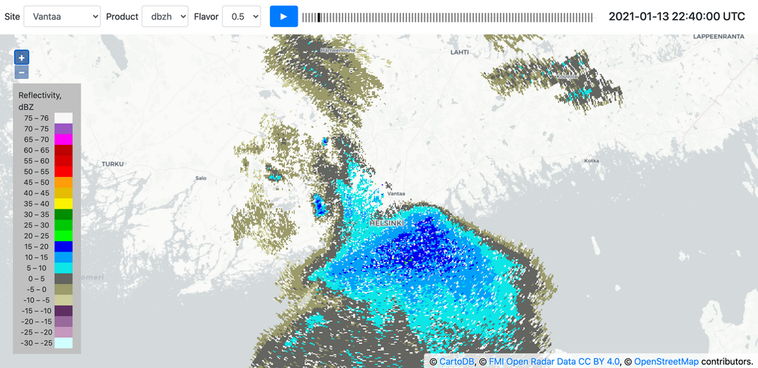
PPI is a weather radar product display running in the browser. Despite it's name referring to a very specific product, PPI, it can (theoretically) be used to visualize any raster products in Cartesian coordinates.
There's a deployment running at https://radar.a3h.net/ that displays FMI's PPI reflectivity products for individual radars.
Features
- reprojection
- coloring
- product animation
- decent base map
- keyboard shortcuts (SPACE, LEFT, RIGHT, S, P, F)
- rudimentary cursor tool (show value under cursor)
Future plans
- show distance to points of interest, e.g. to closest localities / max reflectivity
- range rings
- more products (or moments, e.g. radial velocity)
- more color scales
- product metadata display (PRF etc)
- rendering optimizations
- different animation speeds
- time rather than product based animation
- atmospheric pressure data overlay
- other than FMI data (NEXRAD?)
Known issues
- animation state doesn't currently survive page refresh
- does unnecessary product loads at initialization
There are three main components:
- product downloader (only for FMI right now),
- distribution collector (collects downloaded products, saves them for web distribution),
- client software (JavaScript single page app written in modern JS; React, Redux, OpenLayers)
cd client
make clean && make
cd ..
mkdir -p client/build/radar
python fmi/dist_builder/collect_radar_products.py /path/to/where/you/downloaded/the/stuff | \
    python collect.py fmi/dist_builder/raster_to_json.py client/build/data
cd client
make
- Line density display: https://twitter.com/archillect/status/938533533810937856
- FMI summer color scale for reflectivity
http://wms.fmi.fi/fmi-apikey/<>/geoserver/Radar/ows?service=WMS&request=GetLegendGraphic&format=image%2Fpng&width=500&height=100&layer=anjalankoski_dbzh&style=Radar+dbz+Summer
- From QGIS coloring, should look at the above legend graphic instead
FMI reflectivity (summer)
0 => 255, 255, 255   (nodata)
21 => 108, 235, 243  (kohtalainen)
62 => 65, 154, 90    (kohtalainen)
84 => 241, 243, 90   (sakea)
168 => 206, 2, 2     (sakea)
189 => 131, 10, 70   (hyvin sakea)
251 => 244, 244, 244 ()
- From QGIS coloring, should look at the above legend graphic instead
- Smoothing where every value around is some data value and the value in the point is not scanned or no echo.
