Run the following command to launch requirements in the project directory:
docker-compose -f docker-compose.yml up
Kafka, Zookeeper, kafka manager, postgres and pgAdmin should be started after successfully running mentioned command.
Open Kafka-manager on browser on: localhost:9000.
Build a new cluster. Set the Cluster Zookeeper Hosts to: zookeeper:2181.
Make sure to enable following options as well:
- Enable JMX Polling (Set JMX_PORT env variable before starting kafka server)
- Poll consumer information (Not recommended for large # of consumers if ZK is used for offsets tracking on older Kafka versions)
- Enable Active OffsetCache (Not recommended for large # of consumers)
After successfully building a cluster, build a top with the name: testTopic
Open pgAdmin on browser on: localhost:5555.
Create a new server.
Set the database username and password to 'user' and 'admin' respectively. (in case any other arbitrary combination used, database credentials should be modified correspondingly)
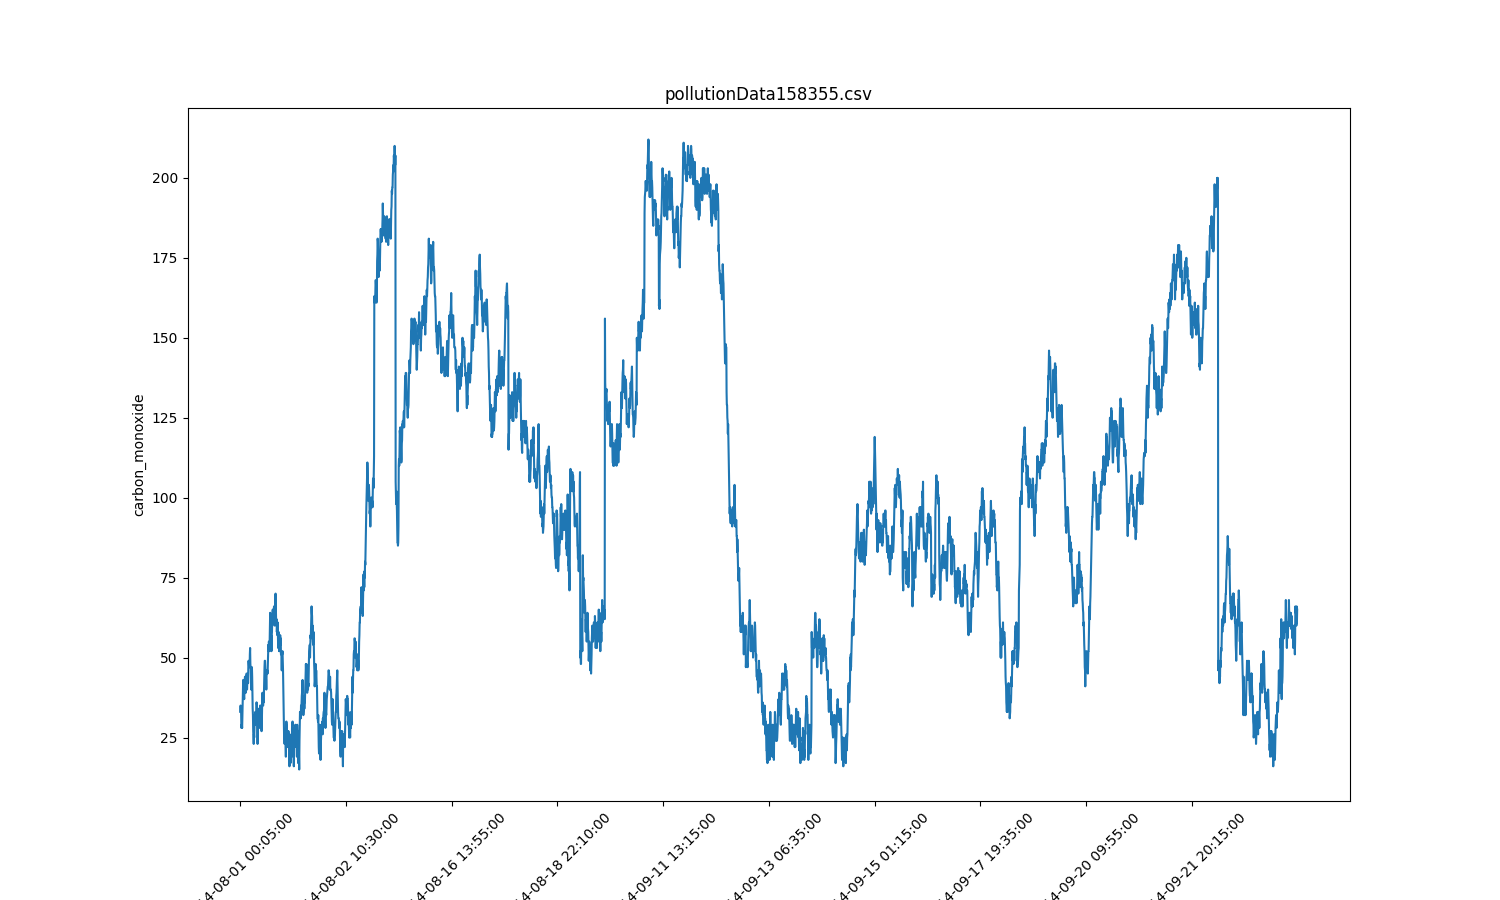
plotLineChart method:

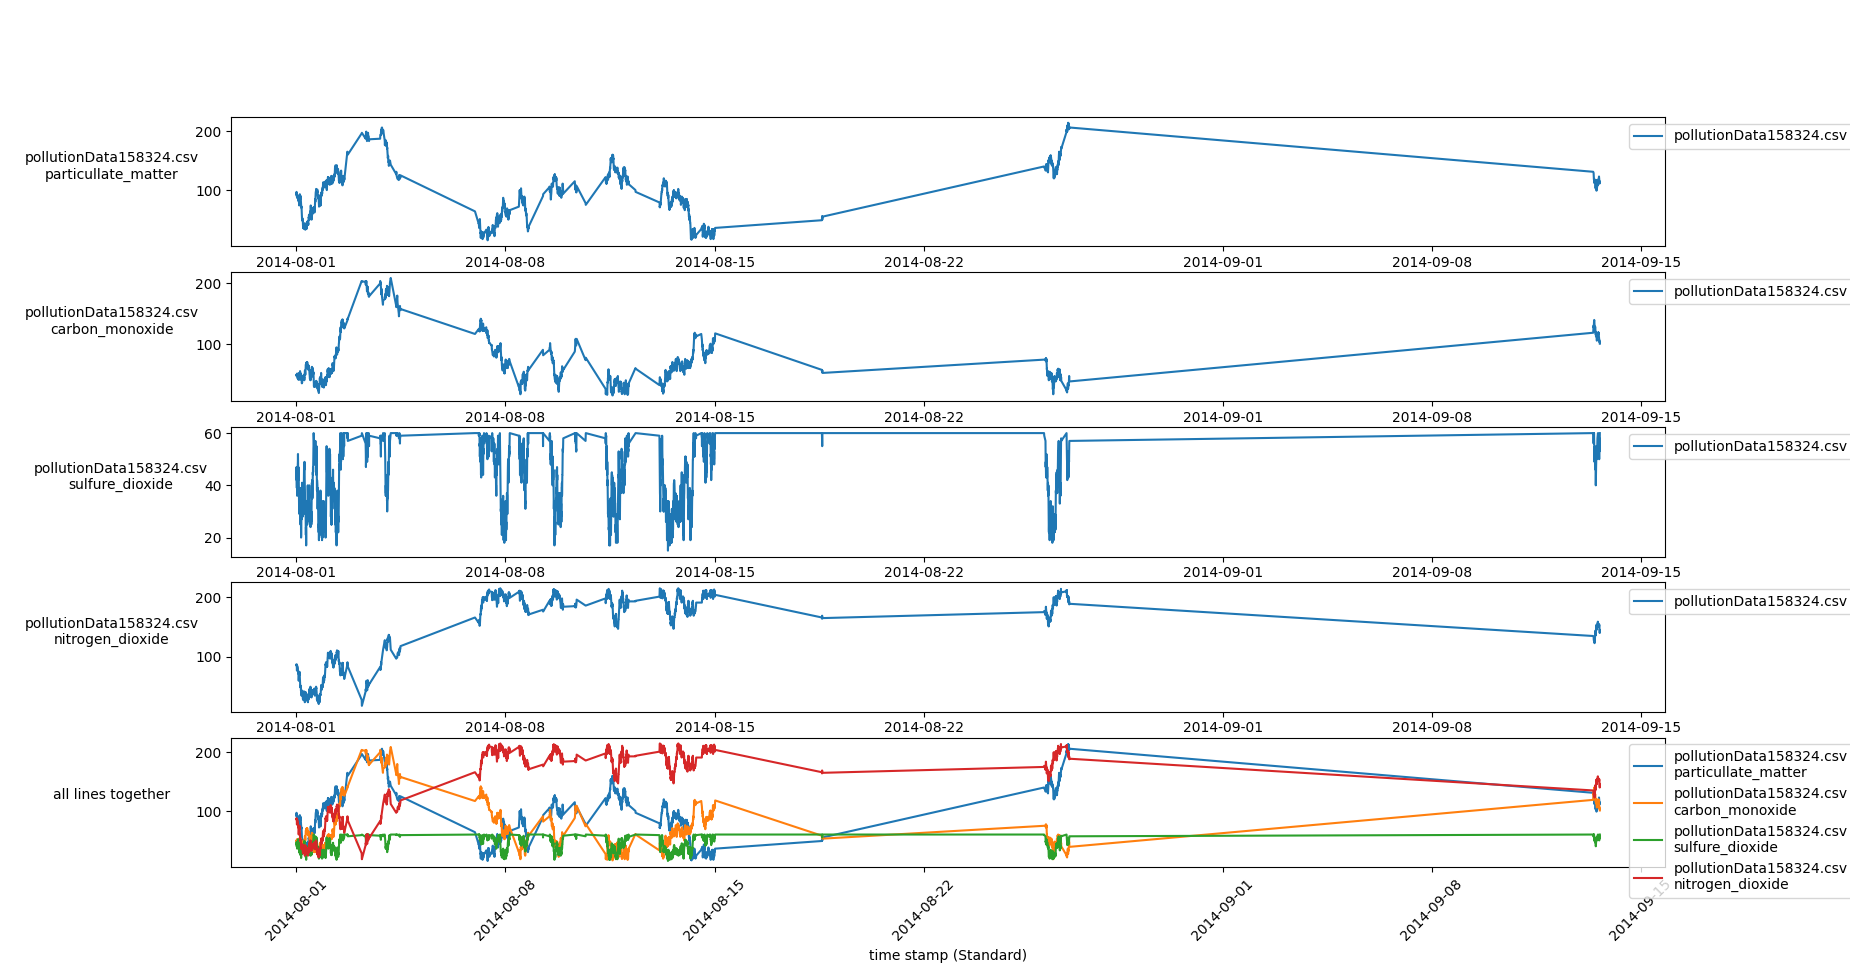
Calling this staticmethod on CSV files will plot values of second argument (E.g. "carbon_monoxide") with regards to tiemstamps. First argument containing the CSV files names, can include multiple files or just one. In case multiple files gives, charts will be plotted separately. X axis which includes timestamps, is not a standard time line, but it is set based on the data available in the CSV fiel, in other words X axis only contains ticks which are in the CSV file and not based on a regular standard time line.
example 1 :

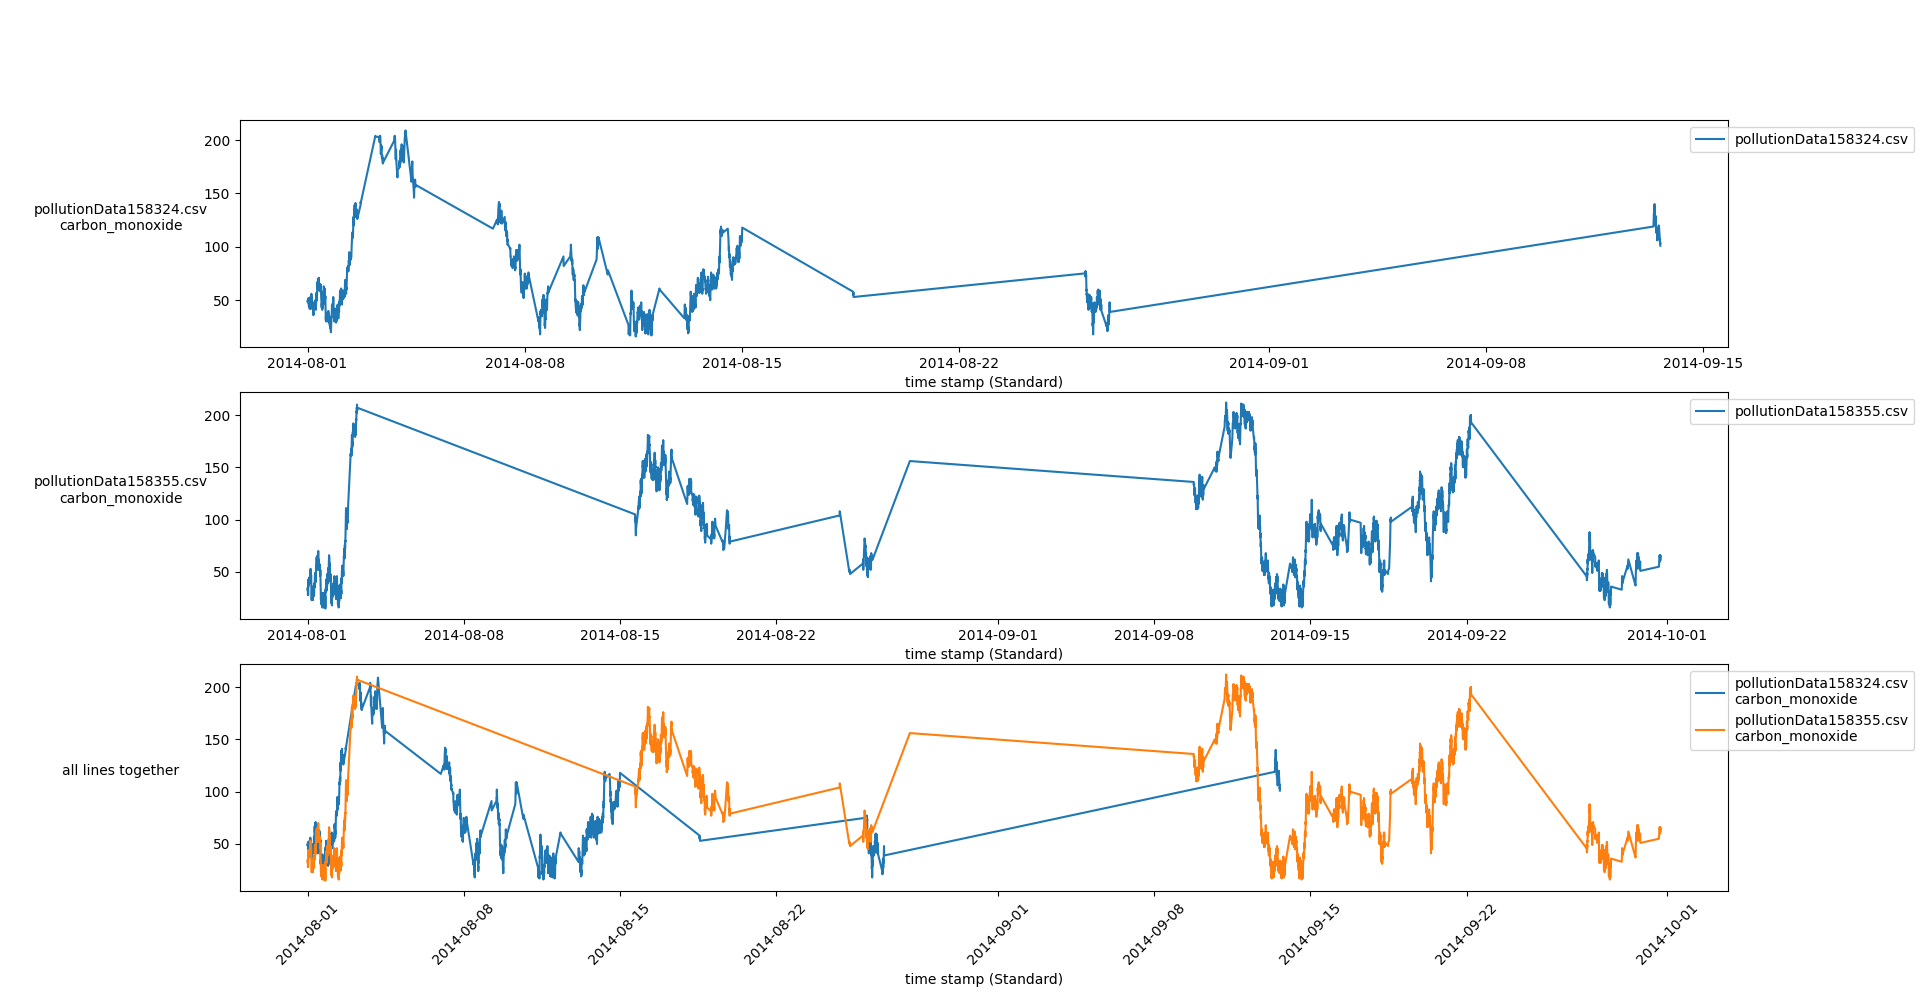
plotCustomLineCharts method :
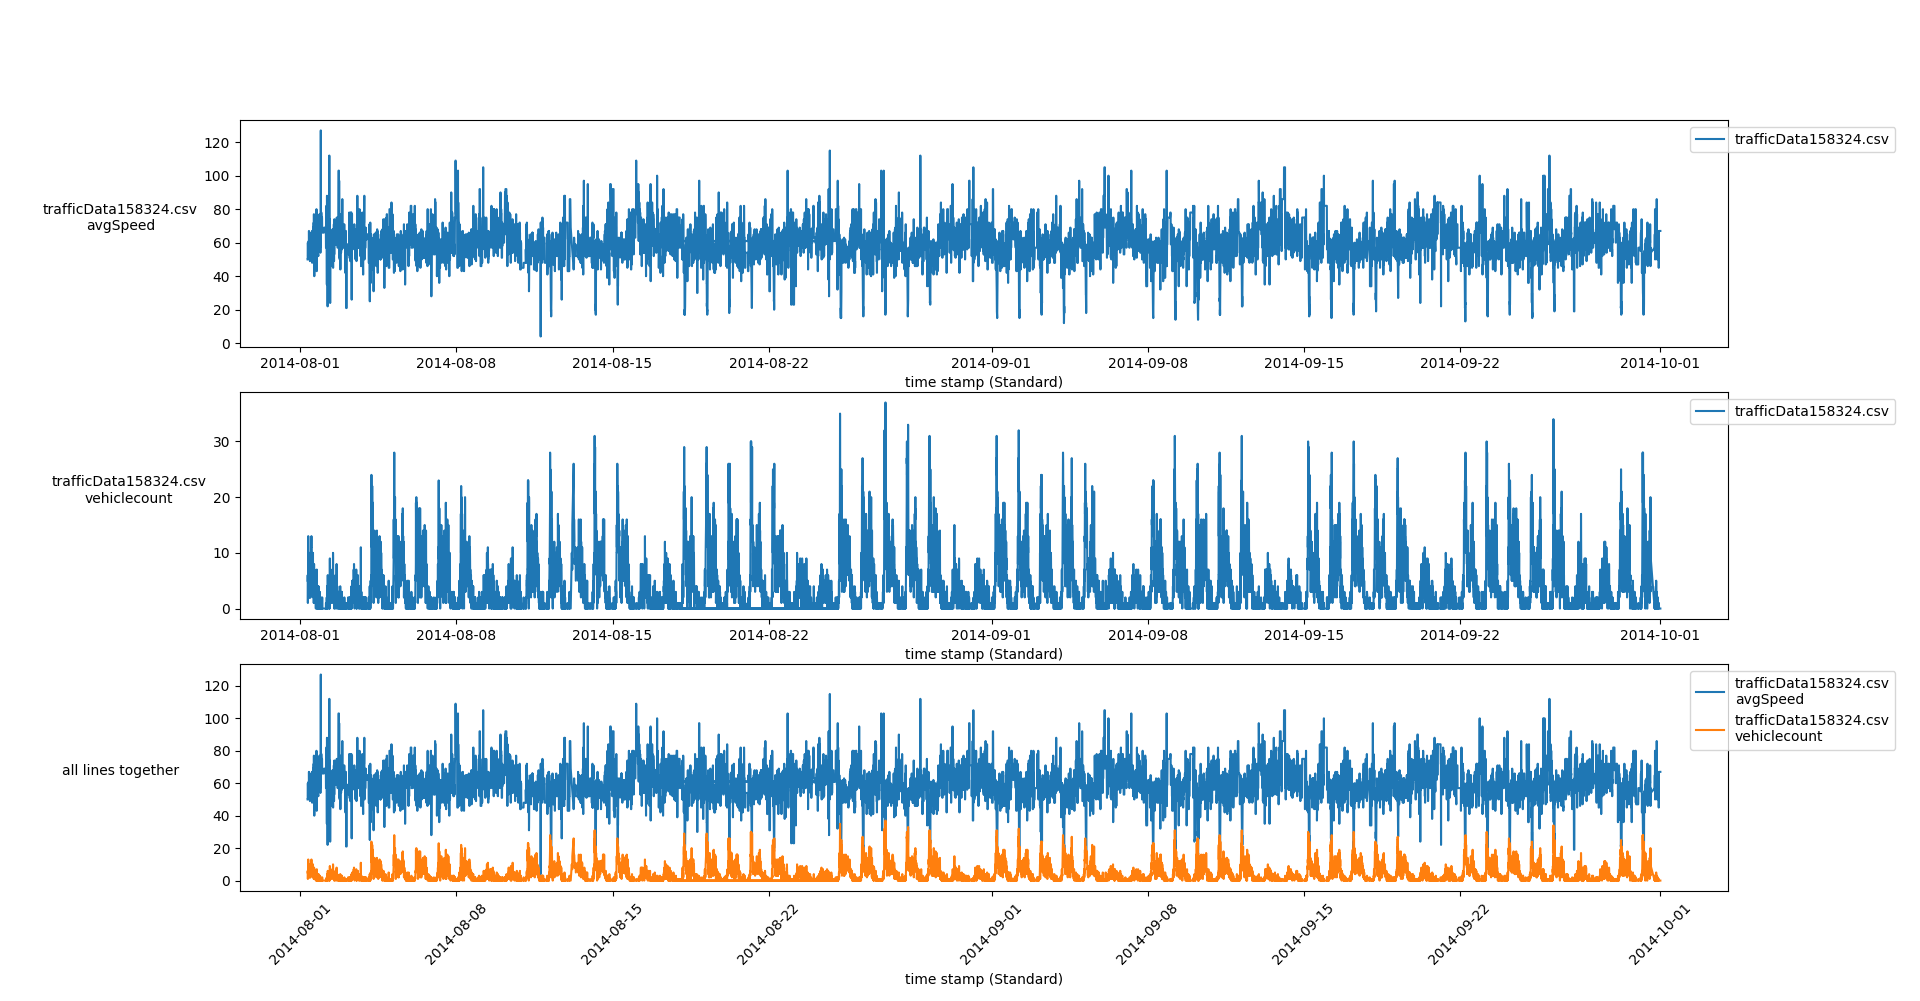
Arguments if this staticmethod are lists which contain full address or just the name of the file as first element and the column header to be plotted as second element of the list. X axises are regular standard time lines and x axis ticks contain all timestamps even if they are not in the CSV file's rows. Examples are as follow:
example 3 :

example 4 :

example 5 :
createFormattedAddressColumn method :
Calling this classmethod on CSV files which include data referring to a physical location (E.g. "latitude" and "longitude" as the initial data of a location) will add a new column called: "Formatted Address" containing the formatted address of the initial location. An example of this method's function is given below:
initial .CSV file :

A SQL database containing initial and formatted addresses of location is created for higher effiency:

removeRowsThatViolateAllConditions method :

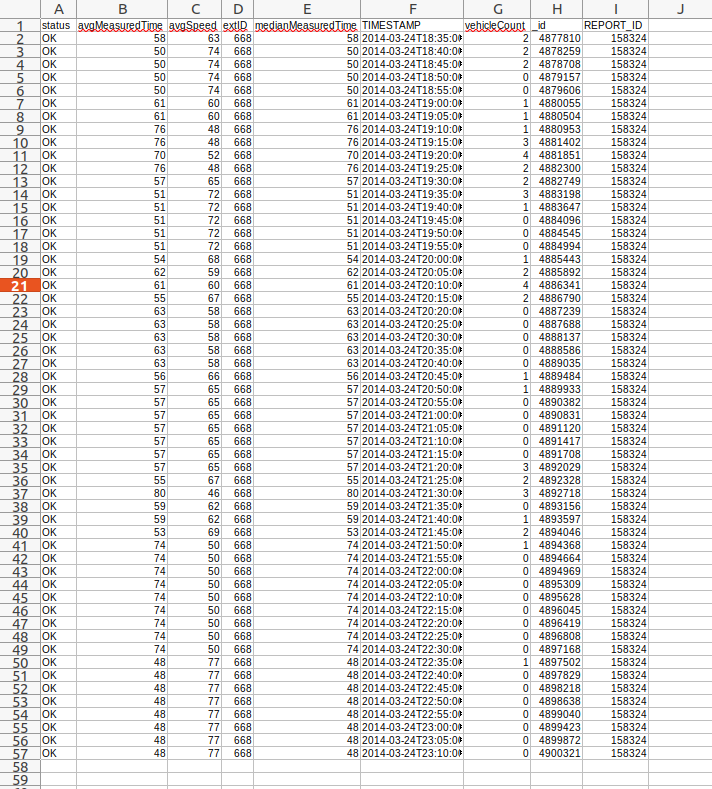
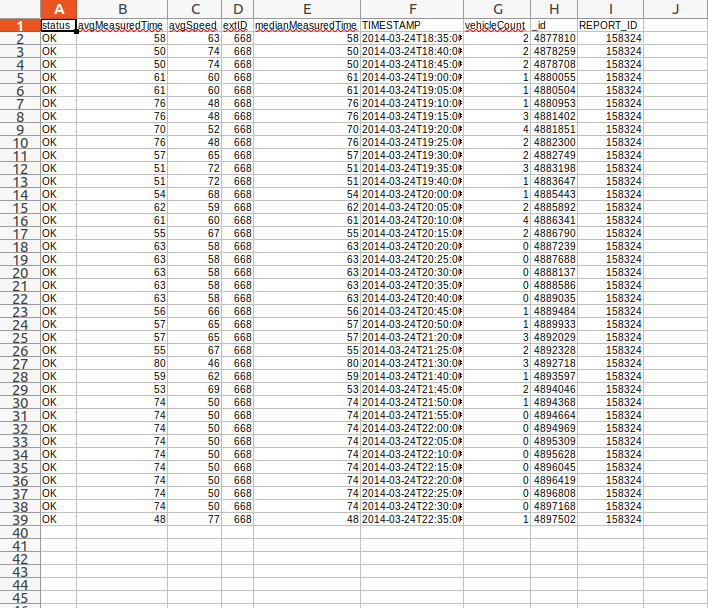
Calling this classmethod on CSV files, will filter rows based on the conditions that are given (E.g. "vehicleCount" msut not be 0), for instance in case method depicted in image above is called, rows that their "vehicleCount" value is equal to 0 and their "avgSpeed" value is larger than 60 and their "sulfure_dioxide" value is larger than 60 will be removed. If rows lack the given headers, related filter will be ignored and other filters will be applied.
initial .CSV file :
