Although Fronius provides a nice web application in the cloud and a mobile application which shows graphs and a history of the produced energy, I still would like to fully own my data and be able to store the data without dependence on a third party service. Hence the motivation to utilize the Modbus data export function of my Fronius inverter to store the data locally in TimescaleDB and Grafana for visualisation.
The Froniud daemon connects to the inverter either with Modbus TCP (network) or Modbus RTU (serial cable) and forwards the data as a formatted JSON string to a MQTT broker. My personal software stack consists of the Mosquitto MQTT broker, which in turn is connected to PostgreSQL with TimescaleDB extension via a NodeRED flow. The complete setup is described in detail at the Smartmeter wiki, but all the necessay files are provided here in the resources section.
Froniusd depends on libsunspec, a library which provides the necessary low level methods to access the inverter and on libmosquitto for connecting to the MQTT broker. Packages of froniusd and libsunspec are published in the AUR. If you need to compile Froniusd directly from source, a Makefile for (cross-)compilation is provided.
make CROSS_COMPILE=aarch64-unknown-linux-gnu
make install
Instructions how to setup a cross toolchain and how to compile and install libmosquitto into the toolchain can be found here.
The Arch Linux package provides a systemd service file and installs the configuration file in /etc/froniusd/froniusd.conf. The service can be started with:
systemctl start froniusd
When building directly from source, the daemon can be directly started with:
froniusd --config resources/config/froniusd_example.conf
The Arch Linux package installs a docker compose in /etc/froniusd/docker-compose.yaml and a Dockerfile. Alternatively, these files are also in the root folder or the source. For Modbus RTU, the serial device needs to be set in docker-compose.yaml in addtion to fronius.conf to give Docker access to the USB device.
docker-compose up --build
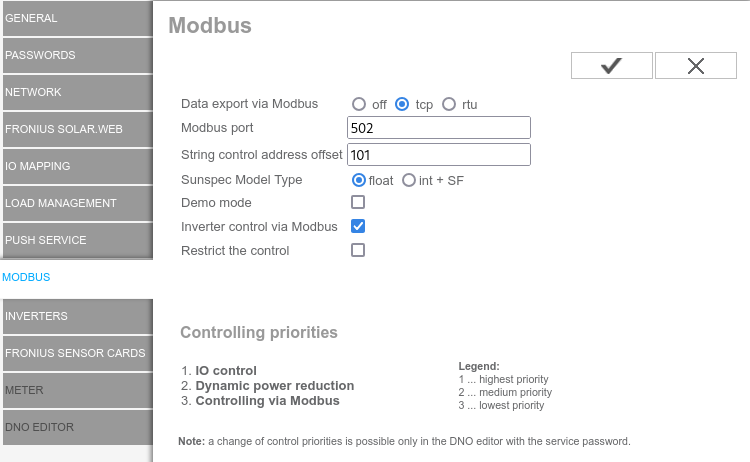
Before Froniusd is able to connect to the inverter, the Modbus data export needs to be enabled in the web interface. Here you have the choice between tcp and rtu mode. In case of rtu, a serial RS485-to-USB converter is required to connect the inverter to the host running Froniusd.
A minimal froniusd.conf config file looks like this:
modbus_tcp primo.home.arpa
# modbus_rtu /dev/ttyUSB0
mqtt_topic solarmeter
mqtt_broker localhost
payment_kwh 0.3914
Here modbus_tcp is the hostname or IPv4/IPv6 address of the inverter and modbus_rtu the serial device of the USB converter. You can only set either of these keywords, but not both. The rest of the keywords are the hostname of the MQTT broker, the topic to publish to, and the payment for each produced kWh. A fully commented example is provided in the resources section.
Example JSON string published by Froniusd in the solarmeter/live topic:
{ "time":1729597414501,    # timestamp, sec since epoch
  "ac_energy":6813.517,    # AC total energy counter, kWh
  "ac_current":3.330,      # AC current, A
  "ac_voltage":234.400,    # AC voltage, V
  "ac_power_w":781.000,    # AC active power, W
  "ac_power_va":781.016,   # AC apparent power, VA
  "ac_power_var":-7.000,   # AC reactive power, VAr
  "ac_pf":99.996,          # AC power factor
  "ac_freq":50.010,        # AC frequency, Hz
  "ac_eff":94.565,         # AC conversion efficiency
  "dc_voltage_1":292.900,  # DC voltage string 1, V
  "dc_current_1":1.360,    # DC current string 1, A
  "dc_power_1":399.300,    # DC power string 1, W
  "dc_energy_1":3349.270,  # DC total energy string 1, kWh
  "dc_voltage_2":294.200,  # DC voltage string 2, V
  "dc_current_2":1.440,    # DC current string 2, A
  "dc_power_2":426.590,    # DC power string 2, W
  "dc_energy_2":3398.550,  # DC total energy string 2, kWh
  "payment":0.3914         # payment per kWh, € (or whatever)
 }
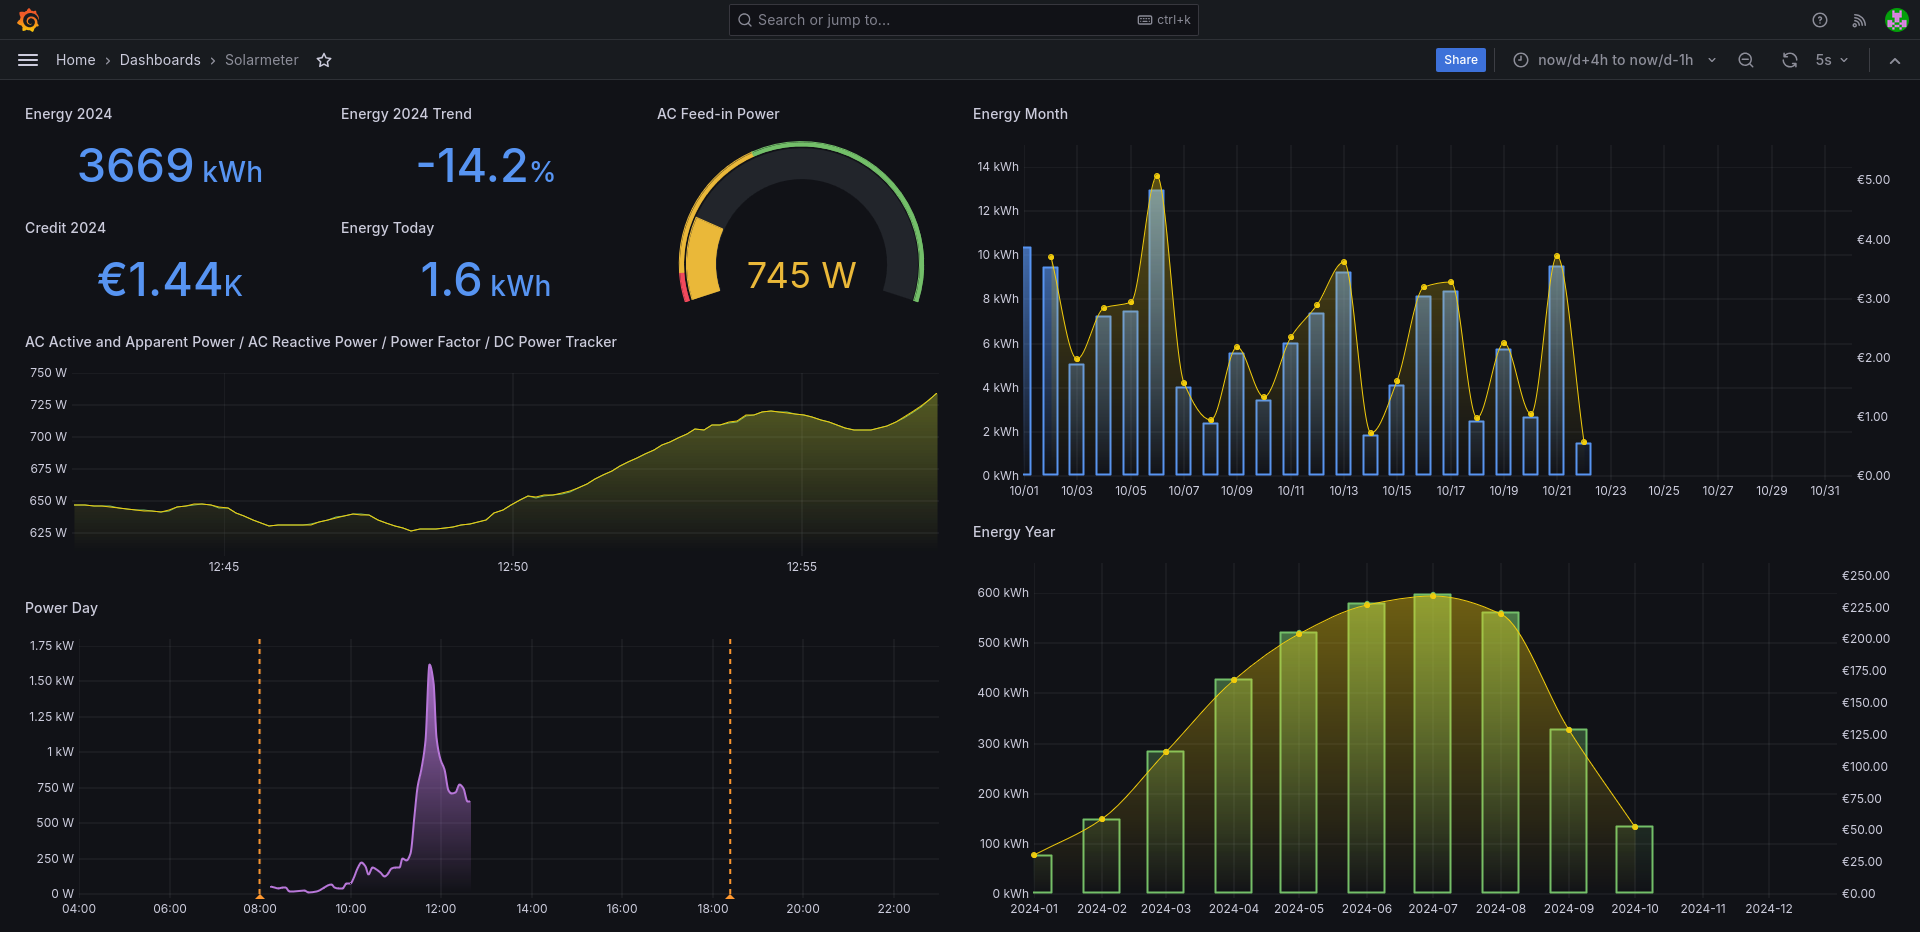
Grafana is used show the current and historic energy production on a dashborad. In my setup, the output from Froniusd is first sent to the Mosquitto MQTT broker, from there forwarded and stored in a TimescaleDB database and then queried by Grafana. Note that the energy trend calculation requires a model of the yearly energy production specific to the actual photovoltaic system. The model folder in the resource section contains a spreadsheet with raw data, a gnuplot fit and the final sql file with my current model.

