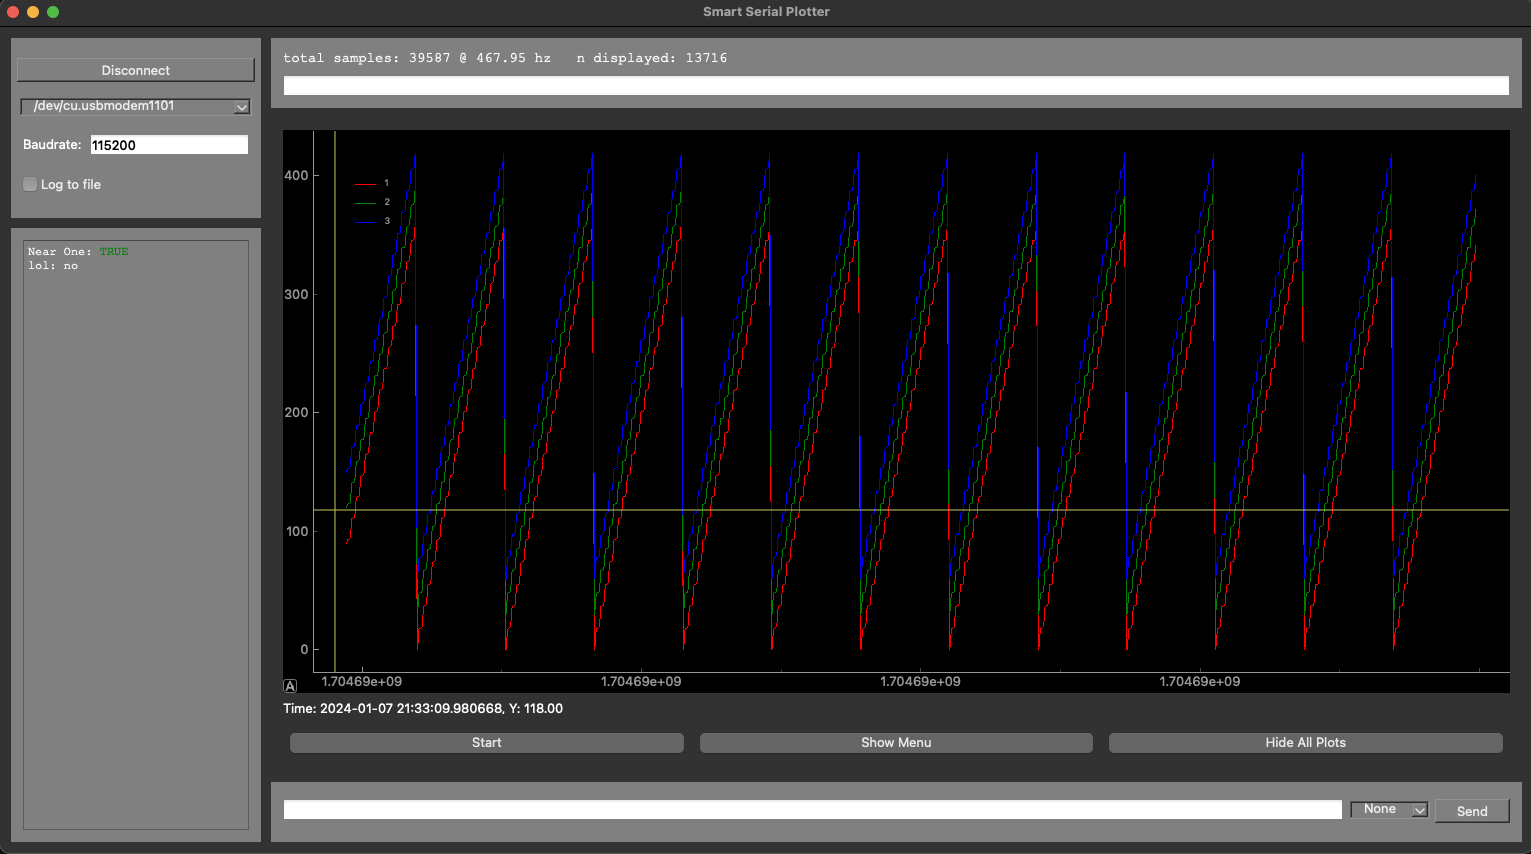
Trends: Display up to 9 trendlines. Toggle between live-view and a static historical view. Liveview draws new datapoints right-to-left. In static historical view, you can zoom and pan. Datapoints keep updating while in static historical view. Statuses: Display live statuses on the left-pane, such as boolean variables, integers, or any other datatype that indicates the status. Examples include fault statuses, GPIO states, and anything else.
✅ Performant: Serial reading, data processing, and visualization are all handled by independent threads. Data is shareed with threadsafe structures.
✅ Easy to Understand: Codebase is contained within one directory, and the core function of the UI and data processing
✅ Simple Message Format: Simple and intuitive serial message format makes this solution compatible with multiple MCUs and multiple frameworks
✅ Data Logging: All messages, TX and RX, are optionally logged to a json for later analysis.
✅ Time Synchronization: If available, Smart Serial Plotter can display and log events at the exact time they happened on the MCU, regardless of local latency issues.
✅ Easily Customizable: Architected to make modifying to specific purposes easy
⭕ Live Analyses: Optional live-analysis of trendlines, overlaid on the plot. Ex. RMS noise on an ADC reading or differential voltage by subtracting two trendlines
⭕ Log Replay: Replay live in slow-motion or view old captures from logfiles
⭕ Export to CSV: When live analysis isn't enough, csv for export to excel or python
- Installing packages globally (reccomended for users)
pip3 install -r requirements.txt
- Using venv (reccomended for developers)
source serialplotter/bin/activate
python3 main.py
