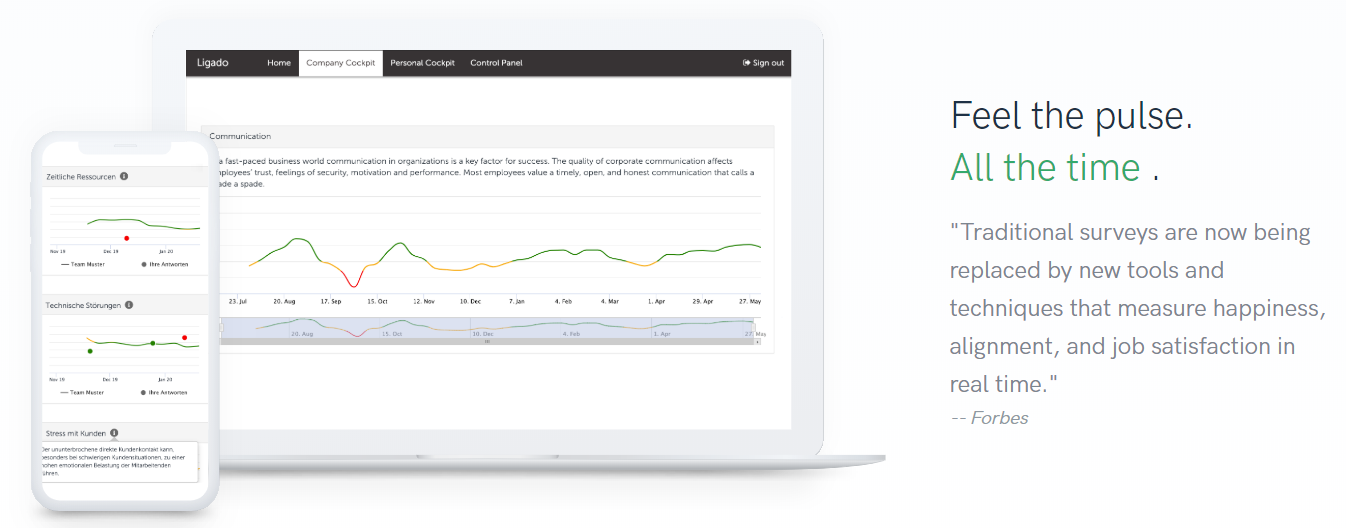
This repository contains examples of analyses and visualizations of Ligado data. Ligado is a web-platform for continuously measuring stress and well-being at the workplace based on repeated short employee surveys. Only the Ligado Demo sub-project is included to demonstrate the approach and algorithms, using synthetic data.
- In order to calculate robust KPI timelines based on sparse survey data, a
moving average algorithm is implemented.

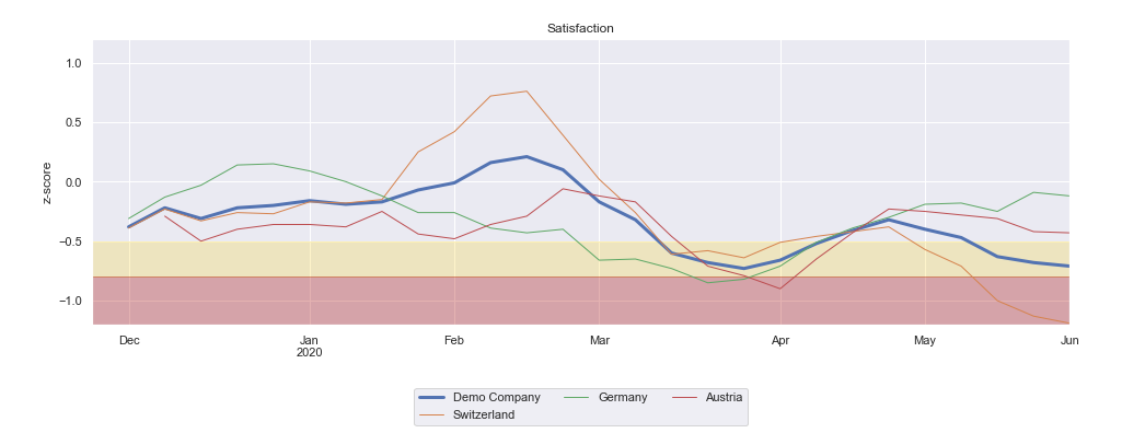
- KPI benchmarks are calculated based on survey data. These benchmarks are used to compare organization units with each other and to quantify deviations from the KPI mean within the organization.
- Deviations from the KPI mean are quantified based on effect sizes and their statistical significance (one-sample t-test against the benchmark). Medium effects fall within yellow zone and critical effects fall within the red zone.
- A nested set model is used to represent the tree structure of the organizational unit hierarchy. This model allows for effizient querying and filtering data for specific units and sub-trees. and parsing.
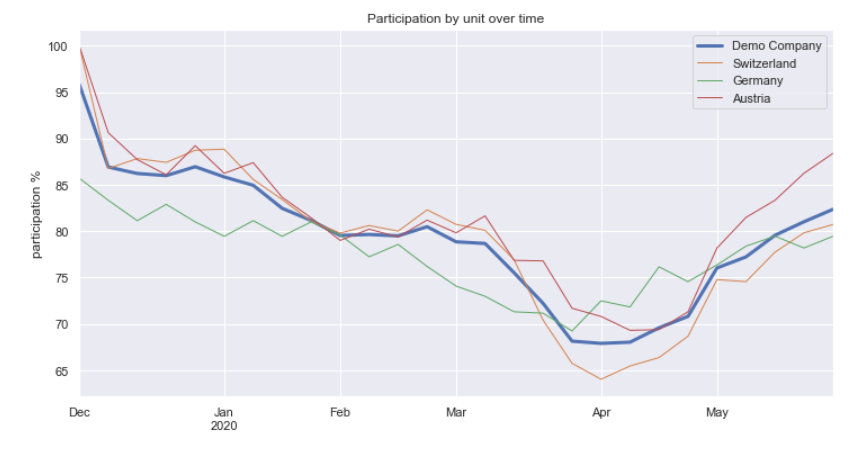
- Participation statistics are calculated for each organization node.

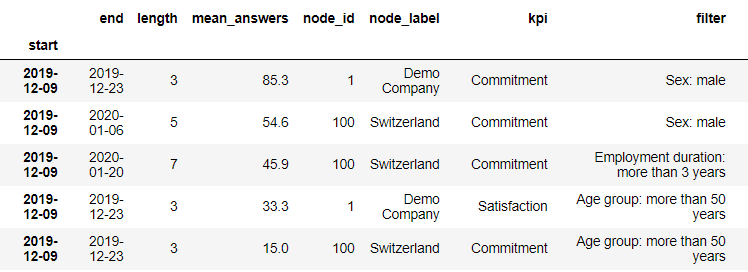
- The KPI data is scanned with several filter combinations to identify time periods with critical
KPI deviations.

- For more, see the ligado-demo jupyter notebook or the html version.
- Handle different data sources: remote DB, local DB, or .csv files.
- Setup for sub-project specific jupyter notebooks sharing the same code base.
- Using .env files to extract security-sensitive credentials from version control.
- Extracting extendable configuration into classes.
- Install anaconda: https://www.anaconda.com/distribution/
- Set up the ligado conda environment:
conda env create -f environment.yml - The ligado project .ipynb notebooks work both with JupyterLab and PyCharm
- Copy .env.dist into the
<project>folder (e.g. erni-ligado or sbb-ligado) as .env and adjust the settings. - By default, ligado data is read from a remote production database.
Once the notebook has run, the data read from the DB is stored in
output/import-*.csvfiles. After copying these files into the<project>/datafolder, you can use these files as data source instead of the DB. Just override the config in your project notebook withcfg.data.source = DataSource.CSV.
