- Node exporter
- Guage of DB objects with low costs
- MySQL datasource example in Grafana
- Add explanation(or reference to it) of scrapping periods, windows
Show work configuration of two services and monitoring for them.
Monitoring should allow to show:
- Application URL access via load balancer to show that application accessible for users
- Application System metrics CPU, Memory, DB connections, Thread pools.
- Application Business metrics - some custom metrics calculated on user requests programmatically
- DB availability
- Server resources metrics CPU, Memory, Disk (node_exporter)
Based on these metrics should be developed:
- Alarm triggers
- Graph dashboards
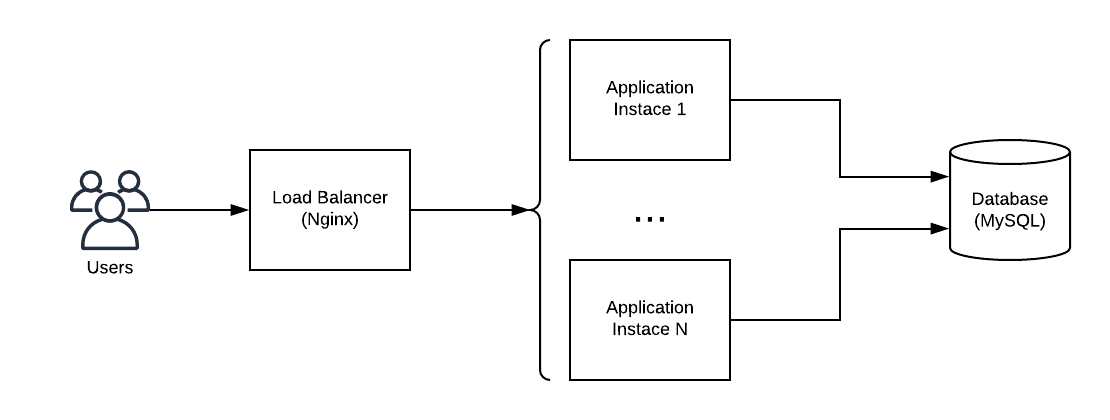
We will have ToDo application which manage list of tasks. In order to store data it will use MySQL. Because it will be deployed in several instances we will use Nginx server as L7 (application/http layer) load balancer.
NB: It is not an AIM of this example to show: application architecture, scaling, load balancing and so on. Please do not use presented configuration as some production ready examples.
Requirements (based on configuration, not required for monitoring it self):
- Gradle 6+
- Java 14+
- Docker
- Docker Compose
# Build JAR artifact to run in container
gradle clean bootJar

# Create common network for two docker compose's if not exists
docker network ls | grep metrics-demo \
    || docker network create metrics-demo

# Run infrastructure: API documentation, Monitoring, DB
docker-compose -f './docker-compose-inf.yml' -p demo-inf up -d --force-recreate

# Please wait here until infrastructure will be available (time to coffee? =)

# Run application: Instances, Load balancer
docker-compose -f './docker-compose-app.yml' -p demo-app up -d --force-recreate --build
NB: Start of demo application and infrastructure separated into different compose files because application requires to have access to the mysql at start of the instances.
NB: Alert manager doesn't start as it have no configuration.
Dont forget to clean up your environment at the end
docker-compose -f './docker-compose-inf.yml' -p demo-inf down
docker-compose -f './docker-compose-app.yml' -p demo-app down

docker network rm metrics-demoHow works load balancer
# Send request each second via load balancer and show app.instance
watch -n1 curl localhost:8888/actuator/infohttp://localhost:9090/new/alerts- current status of triggershttp://localhost:9090/new/targets- targets statushttp://localhost:9090/new/graph- graphs
sum by (instance) (
    rate(http_server_requests_seconds_count[5m])
)
Show URL monitoring alert:
docker stop demo-app_load-balancer_1Call blackbox:
curl localhost:9115/probe?module=http_2xx&target=http://load-balancer/actuator/healthShow app instance monitoring alert:
docker stop demo-app_instance1_1Restore:
docker restart demo-app_instance1_1
docker restart demo-app_load-balancer_1
Show blackbox exporter monitoring alert
docker stop demo-app_blackbox-exporter_1Stop MySQL monitoring alert
docker stop demo-inf_db_1Restore:
docker restart demo-inf_db_1
docker restart demo-app_blackbox-exporter_1
curl -X POST localhost:8888/command/tasks/brokenInitially we have two tasks:
curl localhost:8888/query/tasks | python -m json.toolcurl --header "Content-Type: application/json" \
--request POST \
--data '{ "id": "2384f927-5e2f-3998-8baa-c768616287f5" }' \
localhost:8888/command/tasks/delete curl --header "Content-Type: application/json" \
--request POST \
--data '{ "title": "One more task" }' \
localhost:8888/command/tasks/add 