Darkroom combines the storage backend and the image processor and acts as an Image Proxy on your image source.
You may implement your own Storage and Processor interfaces to gain custom functionality while still keeping other Darkroom Server functionality.
The native implementations focus on speed and resiliency.
Darkroom supports several image operations which are documented here.
go get -u github.com/gojek/darkroomOther ways to run can be found here.
Darkroom supports Prometheus and StatsD for tracking and monitoring metrics.
You need to specify the metrics system by adding an environment variable, METRICS_SYSTEM=prometheus/statsd
The application exposes the metrics at "http://<application_url>/metrics" endpoint. Since it's a pull based system, Prometheus server that is set up from docker-compose scrapes metrics from the application endpoint and its configuration can be changed in prometheus.yml.
In order to use StatsD as your metrics system, you also need to add the following env variables,
METRICS_STATSD_STATSDADDR=hostname:port
METRICS_STATSD_PREFIX=client-prefix
METRICS_STATSD_SAMPLERATE=sample-rate
METRICS_STATSD_FLUSHBYTES=flushbytes
These are used to set up the StatsD client.
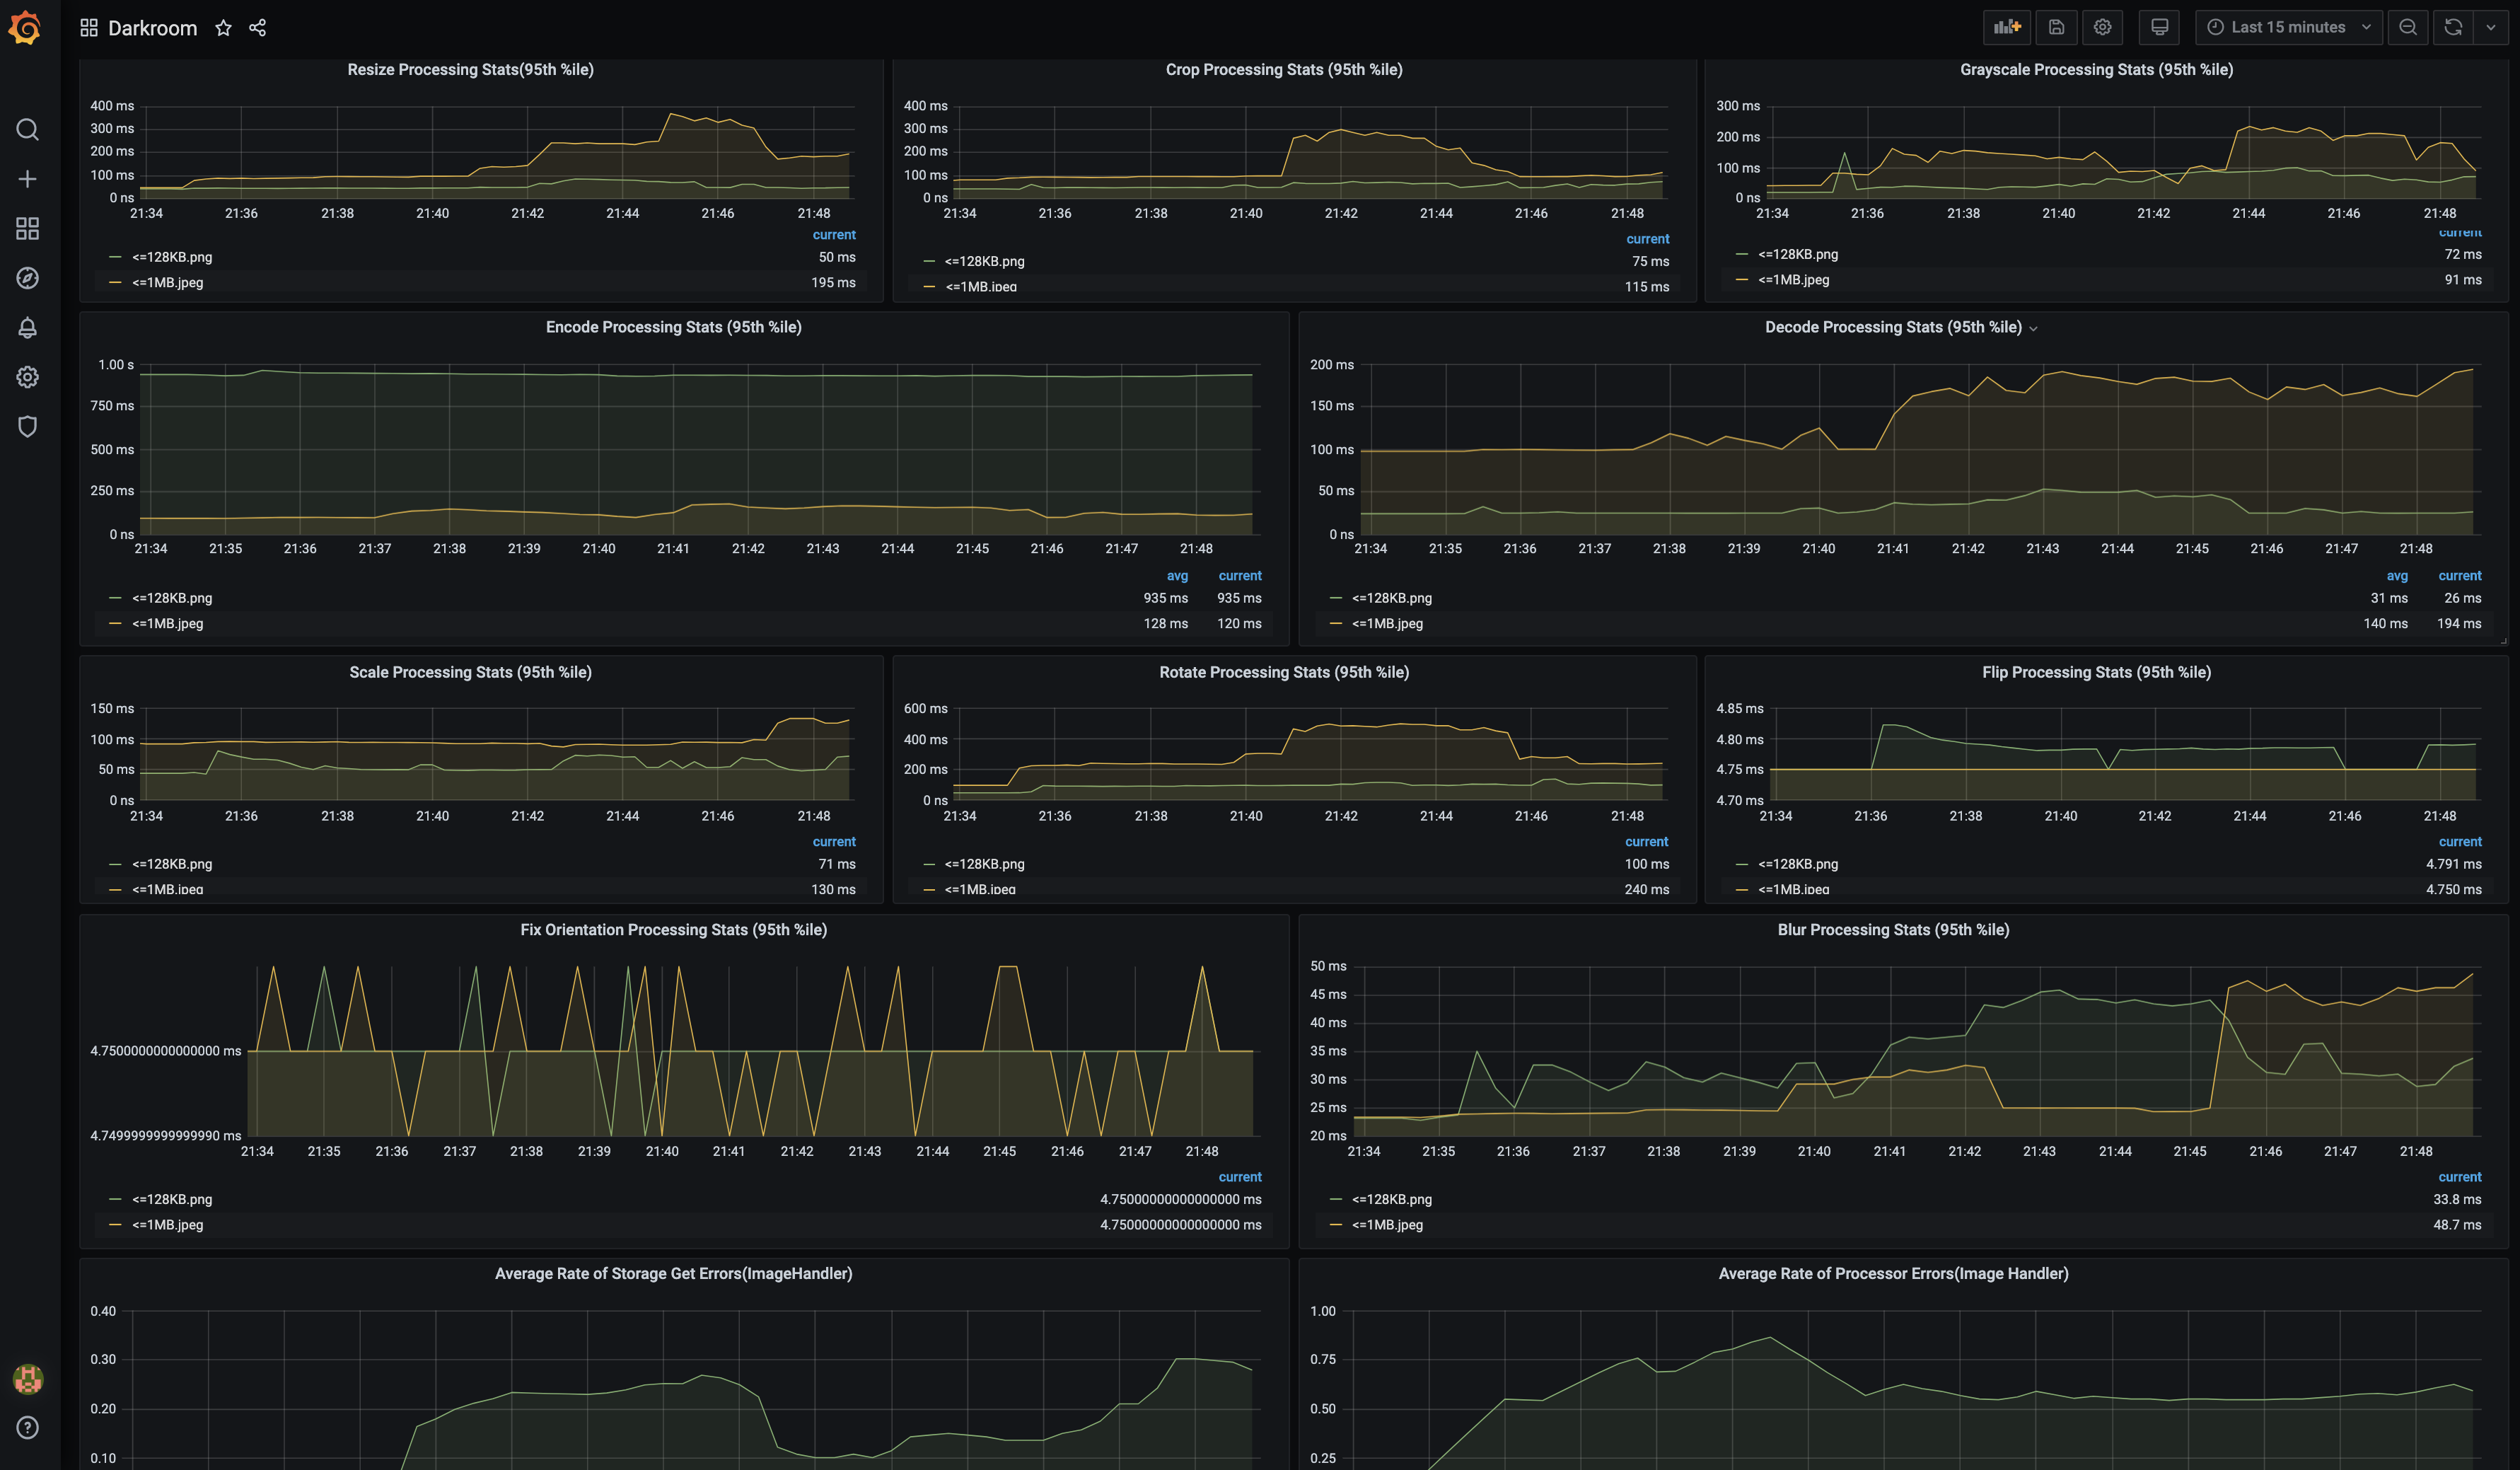
Darkroom currently supports grafana provisioning for Prometheus based metrics.
Grafana is preconfigured with dashboards and Prometheus as the default data source:
- Name: Prometheus
- Type: Prometheus
- Url: http://prometheus:9090
- Access: proxy
Visualization of Darkroom metrics(prometheus) on Grafana:
Read our contributing guide to learn about our development process, how to propose bugfixes and improvements, and how to build and test your changes to Darkroom.
Darkroom is MIT licensed.


