Authors: Yeshwanth Badineni, Akhil Singh Chauhan, Manish katiki, and Mothi Kopparla
- The code that is being imported is of 'json'(Java Script Object Notation) format.
- Data is taken from Chicago Data Portal.
- This dataset reflects reported incidents of crime that occurred in the City of Chicago from 2001 to present, minus the most recent seven days.
- The code retrieves data from City of Chicago | Data Portal
The code, API_Chicago_Crime.ipynb, begins by importing necessary Python packages:
import pandas as pd
import numpy as np
import matplotlib.pyplot as plt
import folium
import seaborn as sns
from folium.plugins import MarkerCluster
-
NOTE: You may need to install folium.
-
You may do that by following the code below:
pip install folium
We then import data from the above mentioned source:
url = 'https://data.cityofchicago.org/resource/ijzp-q8t2.json?$limit=100000&'
df = pd.read_json(url)
df
We then clean our data from some unwanted columns present in the data as follows:
drop = [':@computed_region_awaf_s7ux',':@computed_region_6mkv_f3dw',':@computed_region_vrxf_vc4k',':@computed_region_bdys_3d7i',':@computed_region_43wa_7qmu',':@computed_region_rpca_8um6',':@computed_region_d9mm_jgwp',':@computed_region_d3ds_rm58']
df.drop(drop, inplace=True, axis=1)
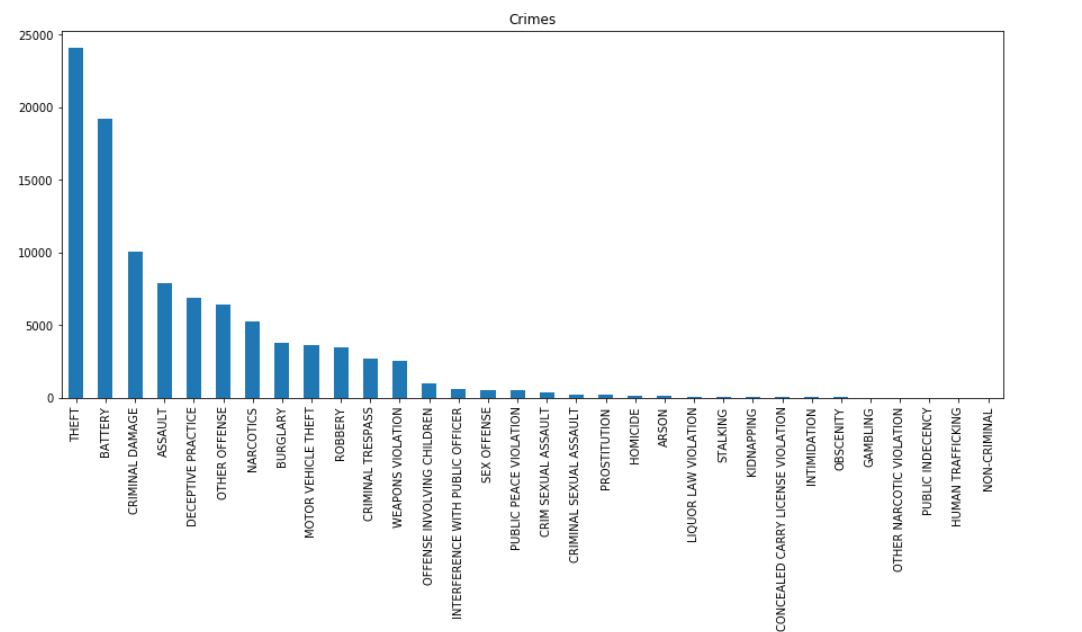
we visualize the data, No.of crimes according to it's category:
plt.figure(figsize=(15,6))
df['primary_type'].value_counts().plot.bar()
plt.title("Crimes")
plt.show()
The output from this code is shown below:
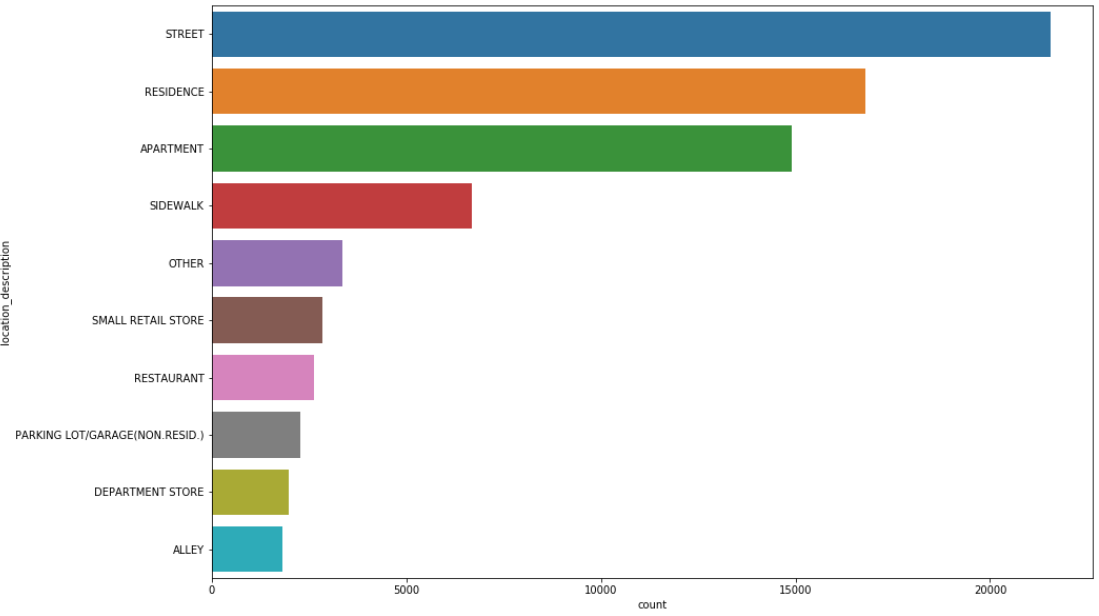
we visualize the data, No.of crimes according to it's location:
plt.figure(figsize = (15, 10))
sns.countplot(y= 'location_description', data = df, order = df['location_description'].value_counts().iloc[:10].index);
The output from this code is shown below:
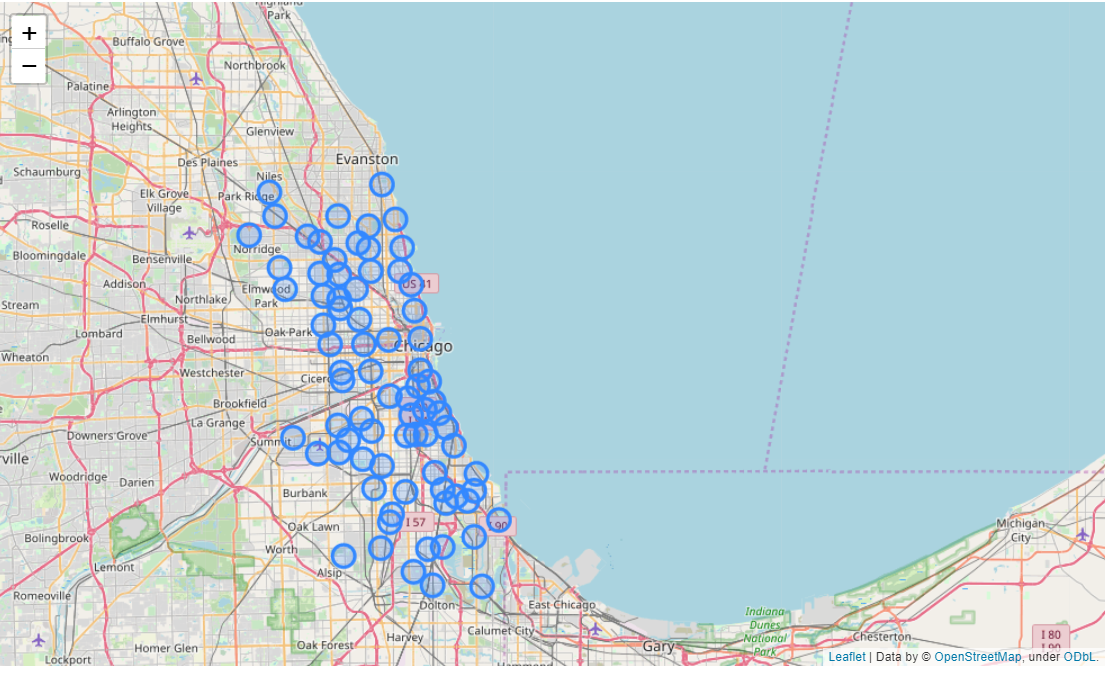
Plotting the communities in Chicago city :
for i in range(len(new_locations)):
    lat = new_locations.iloc[i][0]
    long = new_locations.iloc[i][1]
    popup_text = """Community Index : {}<br>
                Arrest : {}<br>
                Location Description : {}<br>"""
    popup_text = popup_text.format(new_locations.index[i],
                               new_locations.iloc[i][-1],
                               new_locations.iloc[i][-2]
                               )
    folium.CircleMarker(location = [lat, long], popup= popup_text, fill = True).add_to(chicago_map)
The output from this code is shown below:
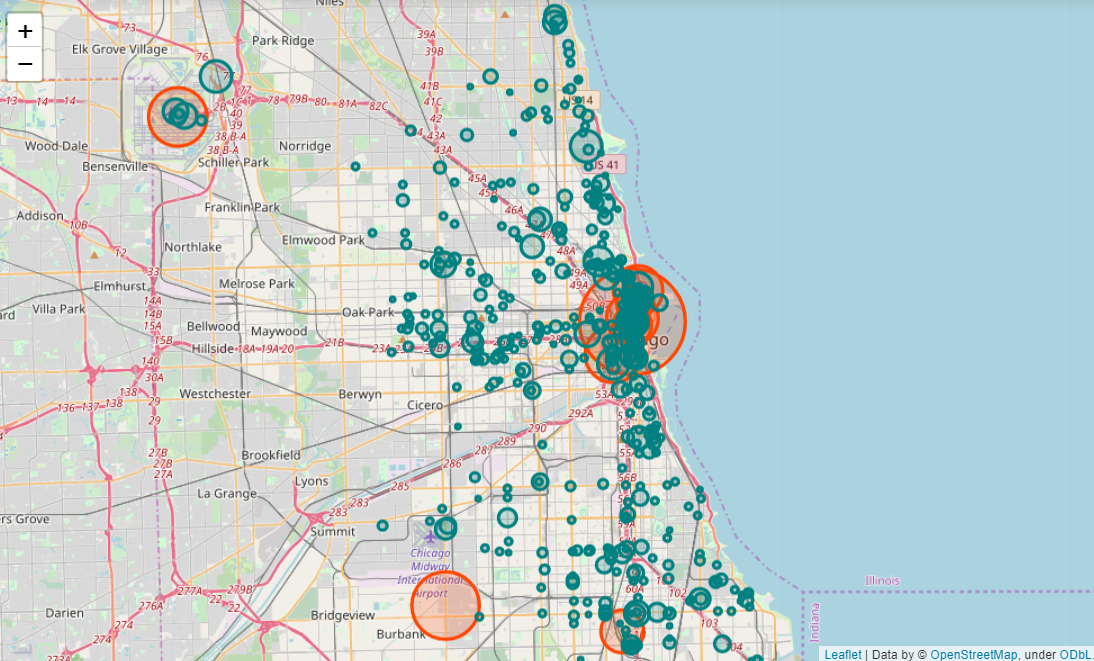
Visualizing the density of crimes in communities:
for i in range(500):
    lat = CR_index['LocationCoord'].iloc[i][0]
    long = CR_index['LocationCoord'].iloc[i][1]
    radius = CR_index['ValueCount'].iloc[i] /5

    if CR_index['ValueCount'].iloc[i] >75:
        color = "#FF4500"
    else:
        color = "#008080"

    popup_text = """Latitude : {}<br>Longitude : {}<br>Criminal Incidents : {}<br>"""

    popup_text = popup_text.format(lat,long,CR_index['ValueCount'].iloc[i])

    folium.CircleMarker(location = [lat, long], popup= popup_text,radius = radius, color = color, fill = True)\
    .add_to(chicago_map_crime)
The output from this code is shown below:
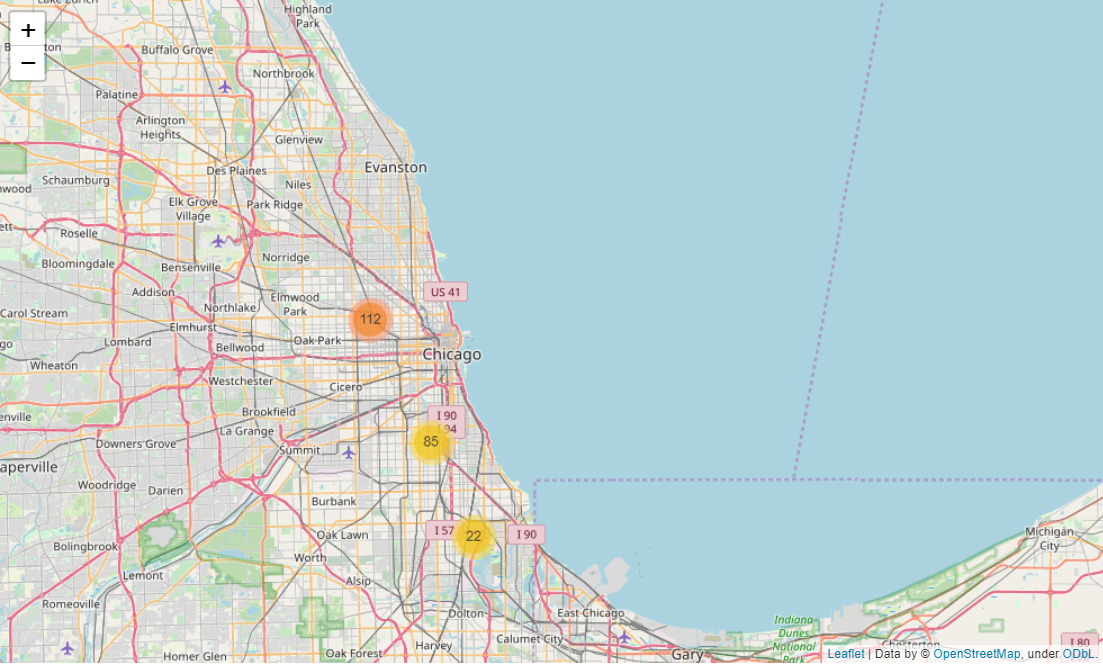
Assaults commited with guns by location:
mc = MarkerCluster()
for row in gun_Battery_df.itertuples():
    mc.add_child(folium.Marker(location=[row.latitude,  row.longitude], popup= 'gun'))
my_map1.add_child(mc)
The output from this code is shown below:
-
Launch Jupyter Notebook on Anaconda.
-
Open and run
API_Chicago_Crime.ipynbcell by cell.
Note: Uncomment the pip install folium , if the package is not pre-installed on the system.
- You can interact with the maps to zoom in and zoom out.
We can further use predictive modeling to predict the crime at a recurring scene and can even suggest more patrolling at specific timings so as to curb crimes at a faster pace. Also studying common types of crimes commited in a location can allow police to take appropriate steps to mitigate them.
