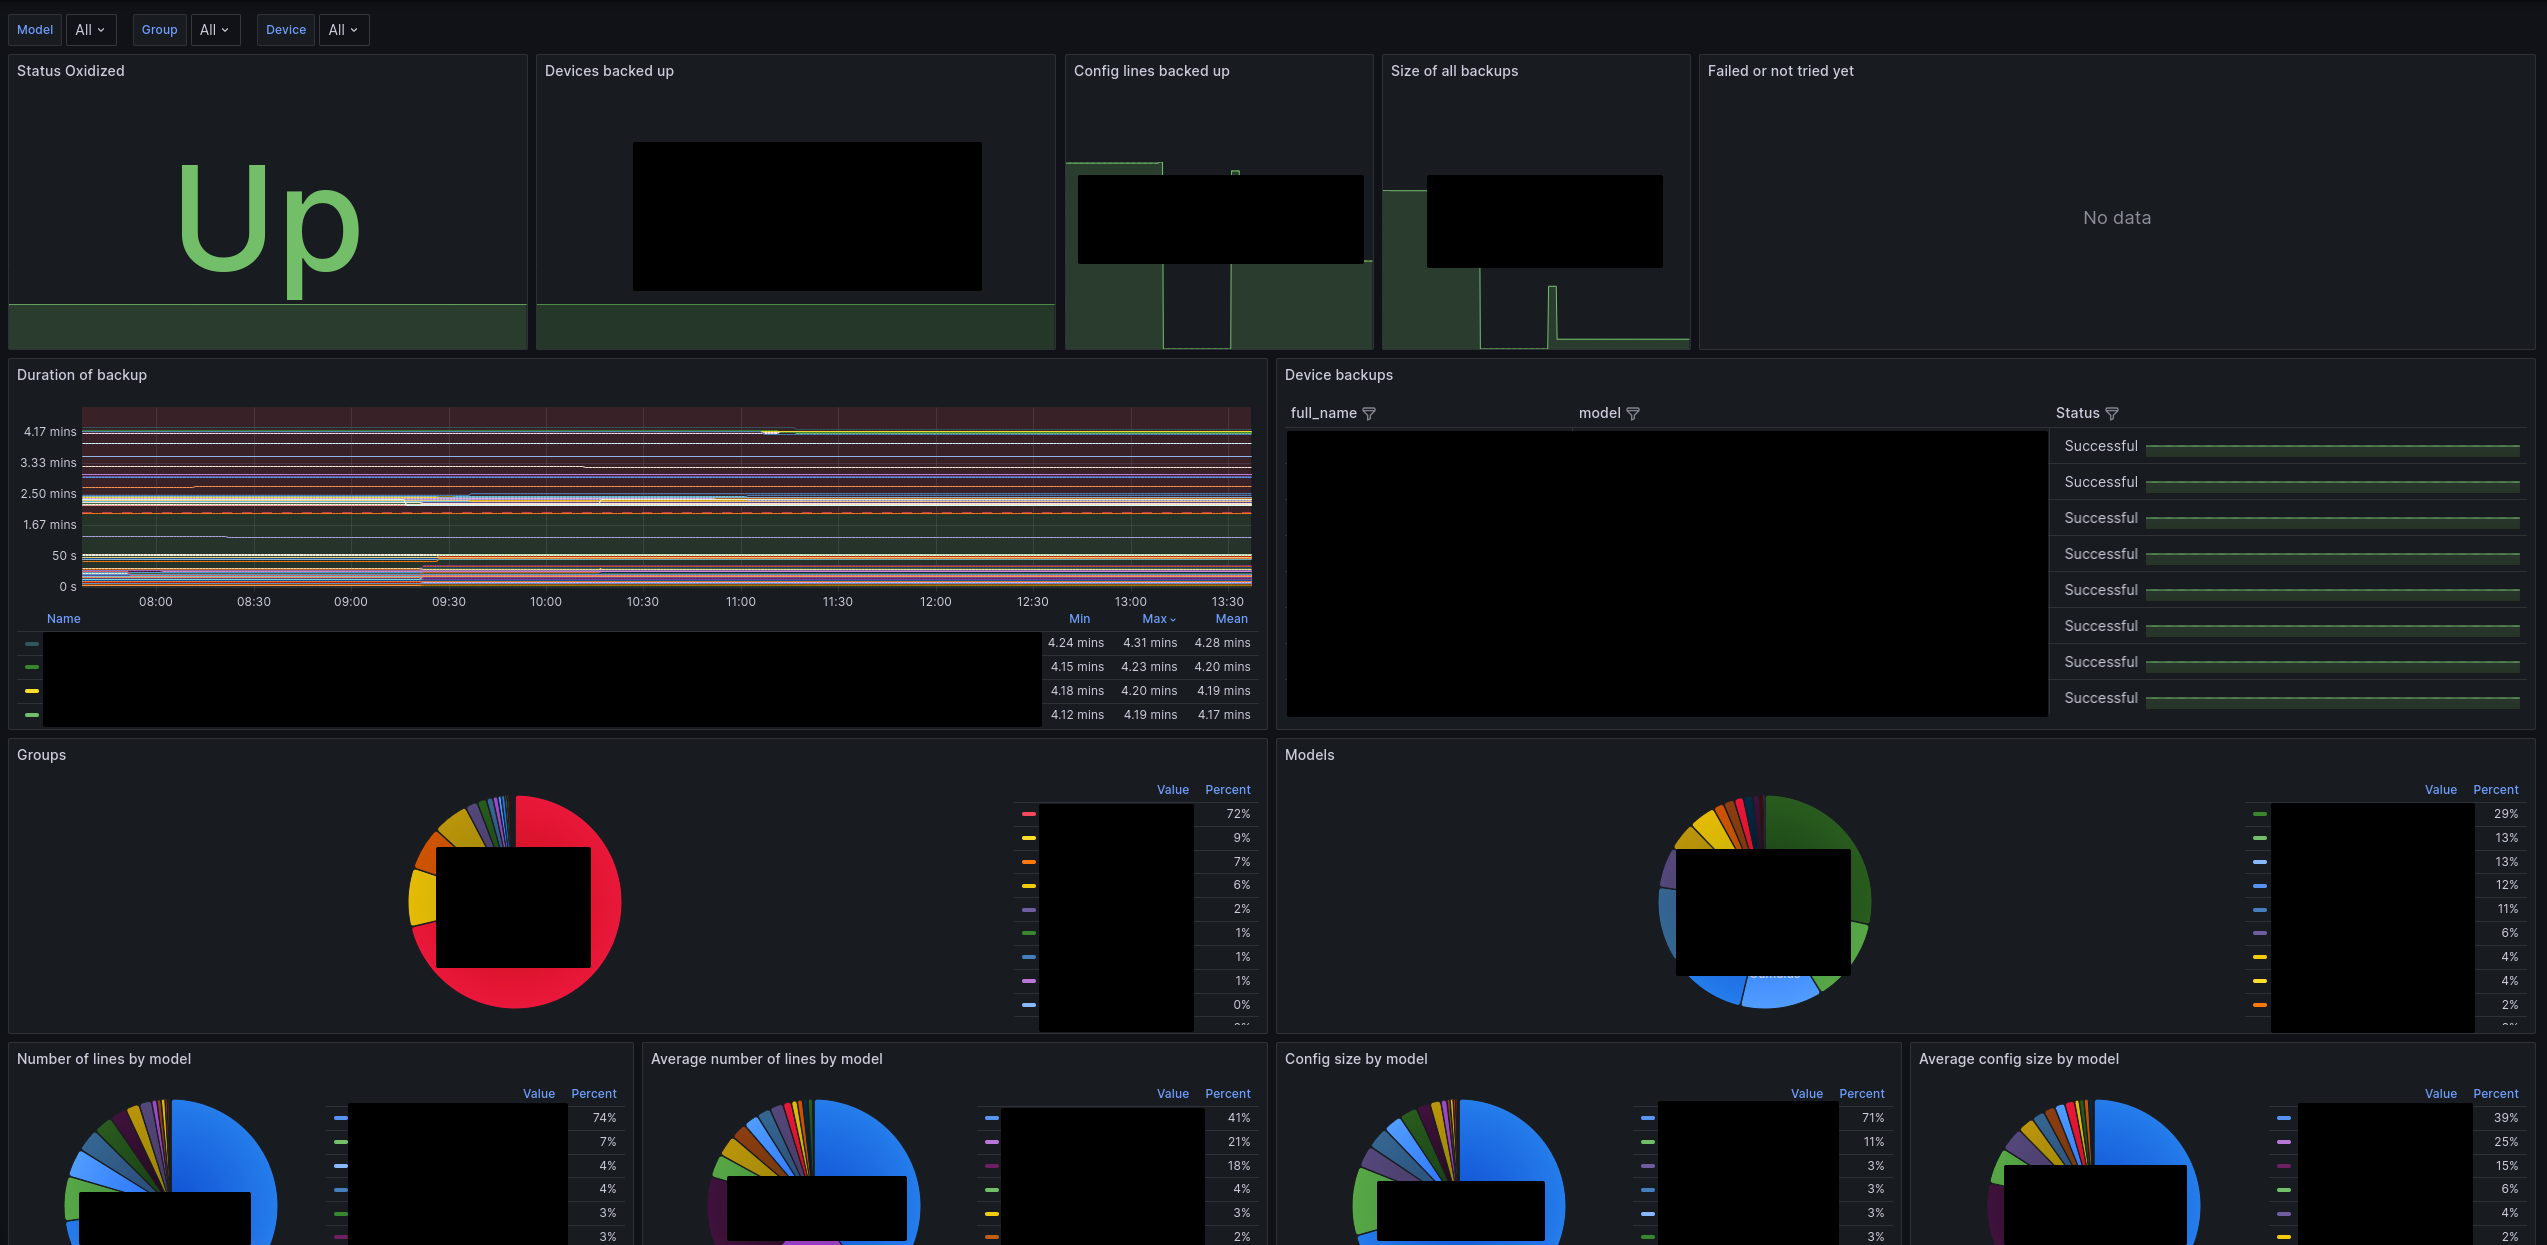
This exporter provides access to metrics sourced from Oxidized, a widely-used tool for backing up network device configurations. With this exporter, you can monitor diverse aspects of your Oxidized setup, encompassing device status, backup details, and configuration metrics.
- oxidized_status
- oxidized_exporter_collect_duration
- oxidized_device_status
- oxidized_device_last_backup_time
- oxidized_device_last_backup_start
- oxidized_device_last_backup_end
- oxidized_device_last_backup_status
- oxidized_device_config_size
- oxidized_device_config_lines
You can install the Oxidized Prometheus Exporter either by downloading pre-built binaries, building it from source, or by using a pre-built container.
The exporter should run behind a reverse proxy, as it does not support TLS and authentication!
Download the latest binary, RPM, or DEB package for Linux from the releases section.
Clone the repository and build the exporter:
git clone https://github.com/akquinet/oxidized-exporter.git /tmp/oxidized-exporter
cd /tmp/oxidized-exporter
GOOS=linux GOARCH=amd64 CGO_ENABLED=0 go build -o oxidized-exporterA container image is available under packages.
You can use Docker Compose to deploy the exporter alongside Oxidized:
---
version: "3.5"

services:
  oxidized:
    restart: unless-stopped
    image: oxidized/oxidized:0.29.1
    ports:
      - 127.0.0.1:8088:8888
    environment:
      - "CONFIG_RELOAD_INTERVAL=600"
    volumes:
      - "./data:/home/oxidized/.config/oxidized"
    env_file:
      - ".env"
    networks:
      - default

  oxidized-exporter:
    restart: unless-stopped
    image: ghcr.io/akquinet/oxidized-exporter:latest
    command:
      - "--verbose"
    ports:
      - 127.0.0.1:8089:8080
    environment:
      - "OXIDIZED_EXPORTER_URL=http://oxidized:8888/oxidized"
    env_file:
      - ".env"
    networks:
- defaultThe exporter supports various configuration options via command-line arguments or environment variables.
Prefix all environment variables with OXIDIZED_EXPORTER.
# Show all available options
$ oxidized-exporter --help
Oxidized exporter for Prometheus

Usage:
  oxidized-exporter [flags]

Flags:
  -d, --debug         Enable debug logging
  -h, --help          help for oxidized-exporter
  -p, --pass string   Password for oxidized API
      --path string   Path to expose metrics on (default "/metrics")
      --port int      Port to listen on (default 8080)
  -U, --url string    URL of oxidized API (default "http://localhost:8888")
  -u, --user string   Username for oxidized API
  -v, --verbose       Enable verbose logging

# Run against an Oxidized instance with basic authentication
$ oxidized-exporter --url "https://oxidized.mydomain.com" -u myuser -p mypass --verbose

$ curl localhost:8080/metricsIntegrate the exporter into Prometheus using the following configuration:
- job_name: "oxidized_exporter"
  scrape_interval: 5m
  scrape_timeout: 300s
  scheme: "https"
  static_configs:
    - targets:
        - "oxidized.mydomain.com"
  basic_auth:
    username: "myuser"
password: "mypass"A example Grafana dashboard is available under docs/grafana-dashboard.json, offering insights into various metrics. Import this dashboard into Grafana for visualization.
- Filter for model, group and device
- Show successful, failed and never backed up devices
- Show backup duration
- Show group and model statistics
- Show number of lines and size of the config for groups, models and devices
