- Archetypes & Monitoring Tools for Java/Apache Camel developers
- Install archetypes
- Create a Spring Boot Camel Project
- Create a Spring Boot Project
- Create a Quarkus Camel Project
- Create a Plain Java Project
- Observability Stack : Grafana Dashboard For Apache Camel
- Install Prometheus & Grafana on local docker engine for testing
- Install Prometheus & Grafana on kubernetes
- Current versions for plain java pojects
- Current versions for spring boot used
- Current versions for quarkus used
- Next steps for this small project
This repo contains archetypes that should be useful to camel developers that don't want to start with common things already included in their projects such as
- Monitoring with Micrometer / Prometheus / Grafana
- HTTP Rest with OpenAPI / SwaggerUI
- Websockets
- Soap with CXF (Optional) -> not supported yet in the latest versions as we transition from javax to jakarta
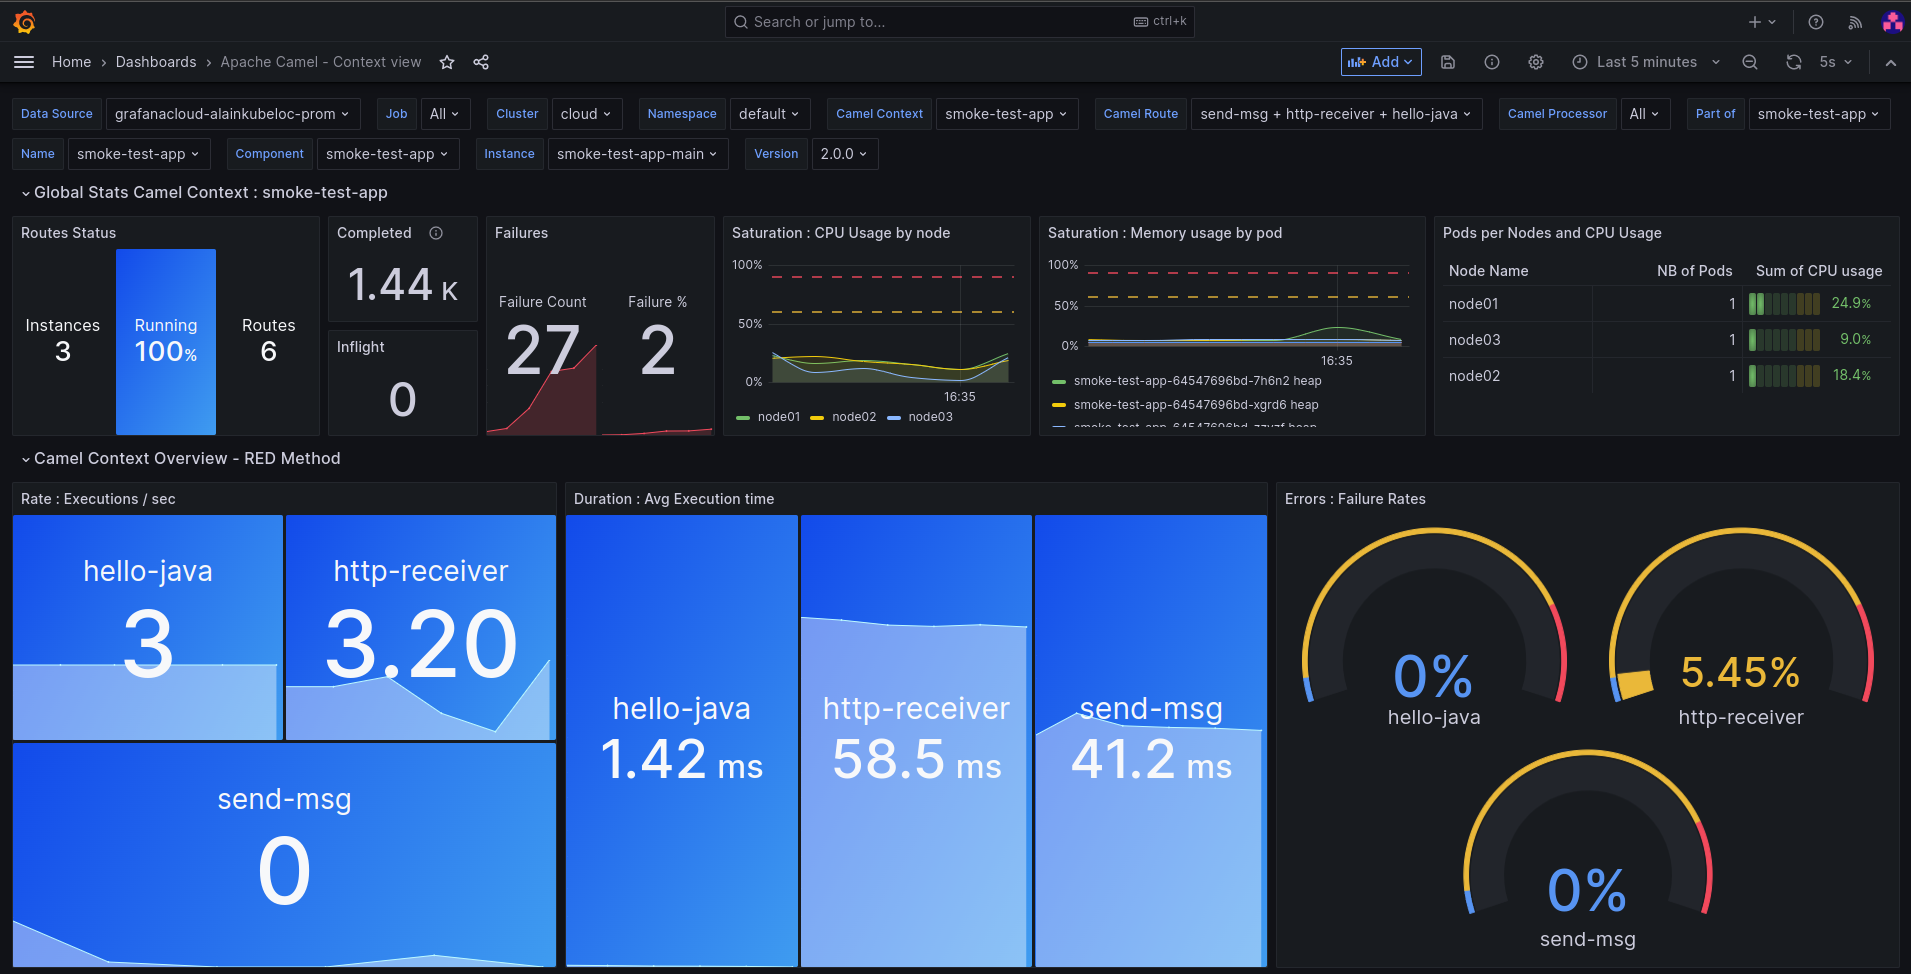
It also contains the a comprehensive Grafana Dashboard for performance monitoring on metrics collected through Prometheus.
mvn -f quarkus-camel/pom.xml install
mvn -f spring-boot-camel/pom.xml install
mvn -f spring-boot/pom.xml install
mvn -f plain-java/pom.xml install
The following is a Spring Boot archetype
mvn archetype:generate \
    -DarchetypeGroupId=net.alainpham \
    -DarchetypeArtifactId=spring-boot-camel \
    -DarchetypeCatalog=local \
    -DarchetypeVersion=1.0.0
The following is a Spring Boot archetype
mvn archetype:generate \
    -DarchetypeGroupId=net.alainpham \
    -DarchetypeArtifactId=spring-boot \
    -DarchetypeCatalog=local \
    -DarchetypeVersion=1.0.0
The following is a Quarkus archetype
mvn archetype:generate \
    -DarchetypeGroupId=net.alainpham \
    -DarchetypeArtifactId=quarkus-camel \
    -DarchetypeCatalog=local \
    -DarchetypeVersion=1.0.0
mvn archetype:generate \
    -DarchetypeGroupId=net.alainpham \
    -DarchetypeArtifactId=plain-java \
    -DarchetypeCatalog=local \
    -DarchetypeVersion=1.0.0
The dashboard that you can import can be found here
In camel 2 we relied on JMX exporter. For Camel 3 & 4, the dashboard now uses metrics exposed by the micrometer library. This offers the same dashboard accross all flavors like Camel Spring, Camel Quarkus and Camel K.
Minimal Apache Camel version required with the changes to micrometer naming convention
- Apache Camel 3.21+
- Apache Camel 4.0.0-M3
ref : https://issues.apache.org/jira/browse/CAMEL-19193
It gives comprehensive metrics for performance monitoring. It focuses on monitoring route execution rate and average executions times that is broken down to processors & routes. You can use it to find your bottlenecks and detect degradations in quality of service.
Videos based on the JMX exporter version (micrometer version to come) : Here : http://www.youtube.com/watch?v=0LDgv1nIk-Y or here : https://odysee.com/@alainpham:8/apache-camel-monitoring-prometheus-grafana:c
docker network create --driver=bridge --subnet=172.22.0.0/16 --gateway=172.22.0.1 camelnet
docker run -d \
    --name=smoke-test-app-quarkus \
    --net camelnet \
    -p 7080:8080 \
    alainpham/smoke-test-app:2.0.1
docker run -d \
    --name=camel-prometheus \
    --net camelnet \
    -p 9090:9090 \
    -v $(pwd)/camel-monitoring/prometheus.yml:/etc/prometheus/prometheus.yml:ro \
    prom/prometheus:v2.45.0
docker run -d \
    --name=camel-grafana \
    --net camelnet \
    -p 3000:3000 \
    -e GF_SECURITY_ADMIN_PASSWORD=password \
    -v $(pwd)/camel-monitoring/grafana-datasources.yml:/etc/grafana/provisioning/datasources/grafana-datasources.yml:ro \
    -v $(pwd)/camel-monitoring/camel-dashboards/:/etc/grafana/provisioning/dashboards:ro \
    grafana/grafana:10.0.1
docker stop camel-grafana camel-prometheus smoke-test-app-quarkus

docker rm camel-grafana camel-prometheus smoke-test-app-quarkus

docker network rm camelnet
Use these commands if you want to quickly test the archetype out including some monitoring
WIP
| Components | Version |
|---|---|
| java | 17 |
| camel-version | 4.0.1 |
| maven-compiler-plugin | 3.11.0 |
| maven-dependency-plugin | 3.6.0 |
| maven-jar-plugin | 3.3.0 |
| logback-version | 1.4.11 |
| Components | Version |
|---|---|
| java | 17 |
| maven-compiler-plugin | 3.11.0 |
| camel-version | 4.0.1 |
| spring-boot-version | 3.1.4 |
| swagger-ui-version | 3.52.5 |
| swagger-codegen-version | 3.0.46 |
| (cxf-codegen-plugin-version) | (4.0.3) WIP |
| logstash-encoder-version | 7.4 |
| webjars-locator-version | 0.47 |
| jmx_prometheus_javaagent | 0.20.0 |
| run-java-version | 1.3.8 |
| temurin-image-version | 17.0.8.1_1-jre |
| Components | Version |
|---|---|
| java | 17 |
| camel-version | 4.0.0 |
| quarkus-version | 3.4.1 |
| maven-compiler-plugin | 3.11.0 |
| surefire-plugin-version | 3.1.2 |
| temurin-image-version | 17.0.8.1_1-jre |
- Add opentelemetry tracing and send data to Grafana Tempo.
- Link metrics to traces.
- Make a video on Grafana dashboard and the newer micrometer prometheus metrics
