Data Analysis Projects - Watch in Github.io
Project #1: Trading Log
-
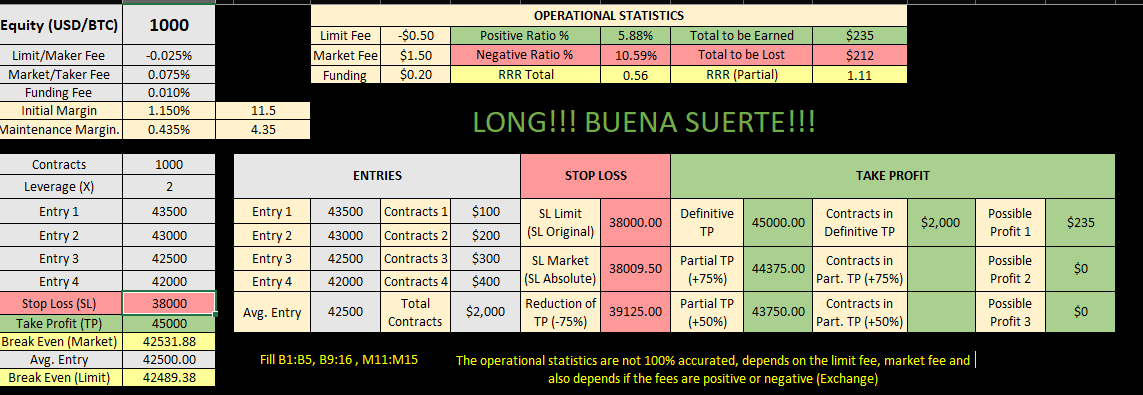
Overview: This trading log helps traders keep a track about their day-to-day trading and the current trade they are doing (or thinking about doing), this historical data can then be used to extract insights whether to take a trade or not to take it.
-
Background: Unconsciously (Ignoring the existence of this field), this was my first step into the data analysis, I am a very organized person therefore if I have the goal of starting (or help someone to start) into a subject that can be quantified it must be through the use of data. I started this project while knowing absolutely nothing about excel but that didn't stop me, I thought about what and how to reflect, created a plan and then searched how to complete the tasks I assigned myself to do.
-
IF, Counts, Macros, Lists, Tables, Sheet-to-sheet, Converter, etc.
Project #2: Selling Records
-
Overview: A project to practice tables and VLOOKUP
-
Background: Decided to further practice the VLOOKUP knowledge
-
Tables, VLOOKUP
Project #1: Intro to Python for Beginners
-
Overview: A guide that contains the most used packages: pandas, numpy, matplotlib, seaborn, example of a class, keywords, functions and datasets to practice
-
Background: My best and favorite project so far, not because of it's complexity but because how useful it has been for me and how it represents me. It's organized, it's helpful, It was made as a plan for the future, it's always there for when you need to check into a syntax that you might have forgotten (quicker than using stackoverflow), always updating it with new important functions
-
Pandas, NumPy, Matplotlib, Seaborn, Datasets, Keywords, Functions, Classes
Project #2: Martin Gale Strat
-
Overview: A simple martin gale strategy calculator
-
Background: I was once in the need to implement the 'Marting Gale Stratategy' into a trading algorithm that I also created but not going to upload it
-
Loops, Dictionaries, Calculations
Project #3: ROI Calculator
-
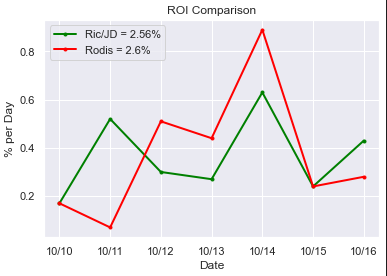
Overview: A simple return-of-investment calculator
-
Background: I was once in the need to know the ROI of two trading algorithms
-
Pandas, calculations, lists, graphs
Project #4: Trades Per Second - Bybit
-
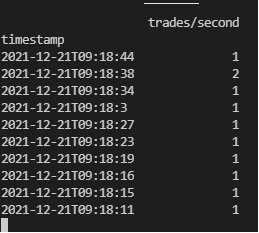
Overview: Using the API of the exchange called 'Bybit' to extract the trades made per second
-
Background: Exploring the API I found ways to POST, REQUEST and DELETE everything about trading, this is one of the useful functions that I used to elaborate my own trading algorithms
-
Pandas, API
Project #5: Correlation - Finding Insights
-
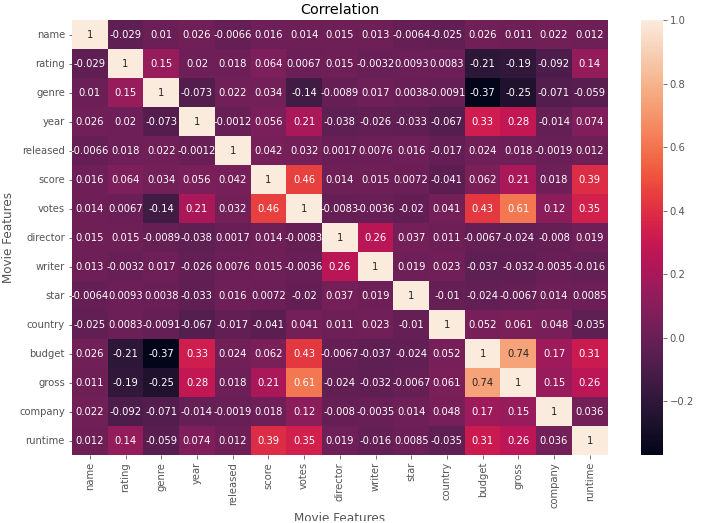
Overview: Cleaning, exploring and then creating visualizations to find insights from a movie dataset
-
Background: The need of improving my knowledge with graphs, correlations and data cleaning in python
-
Pandas, Matplotlib, Seaborn, NumPy, Data cleaning, Data exploration, hypothesis testing
Project #6: Data Collection: Web Scraping
-
Overview: Collecting the data, cleaning, exploring and exporting
-
Background: The need of improving my data gathering skills
-
Pandas, Requests, BeautifulSoup
Project #1: Data Exploration - Covid
-
Overview: Extracted the data from Our World in Data and then proceeded to create tables and calculations to learn more about the covid (total deaths, total cases, total vaccines) and it's impact in the countries/continents populations
-
Background: One of the most common subject out there but at the same time, one of the most important
-
Cleaning, JOINS, CTE, Calculations
Project #2: Data Cleaning - Nashville Housing
-
Overview: This project really helped to feel like a data analyst, creating a plan to decide how to deal with the data applying own criteria and the most common cleaning methods
-
Background: From what I have been told, from what I have read, from what I have seen, data cleaning is the most common task for data analysts
-
Dealing with blanks, string to date, splitting addresses, removing duplicates, further cleaning of strings, deleting columns, etc.
Project #3: Python and SQL
-
Overview: Combination of Python and SQL to save time between Queries, visualizations and modelling
-
Background: The need of doing everything within one tool or fewer tools to save time
-
Dealing with blanks, removing duplicates, deleting columns, managing the database, creating a table, making visualizations and a fitting the cleaned data into a classification model
Project #1: Sales CLP - EDA
-
Overview: This dashboard is a representation of the Sales Forecasting, provides a clear way of seeing the behavior in sales about particular stores through out the years, starting in 2018 to 2022
-
Background: It's easier to extract insights and explain the data with a clear visualization of it, Tableau's Dashboards are excellent to do so.
Project #2: Dashboard - Covid
-
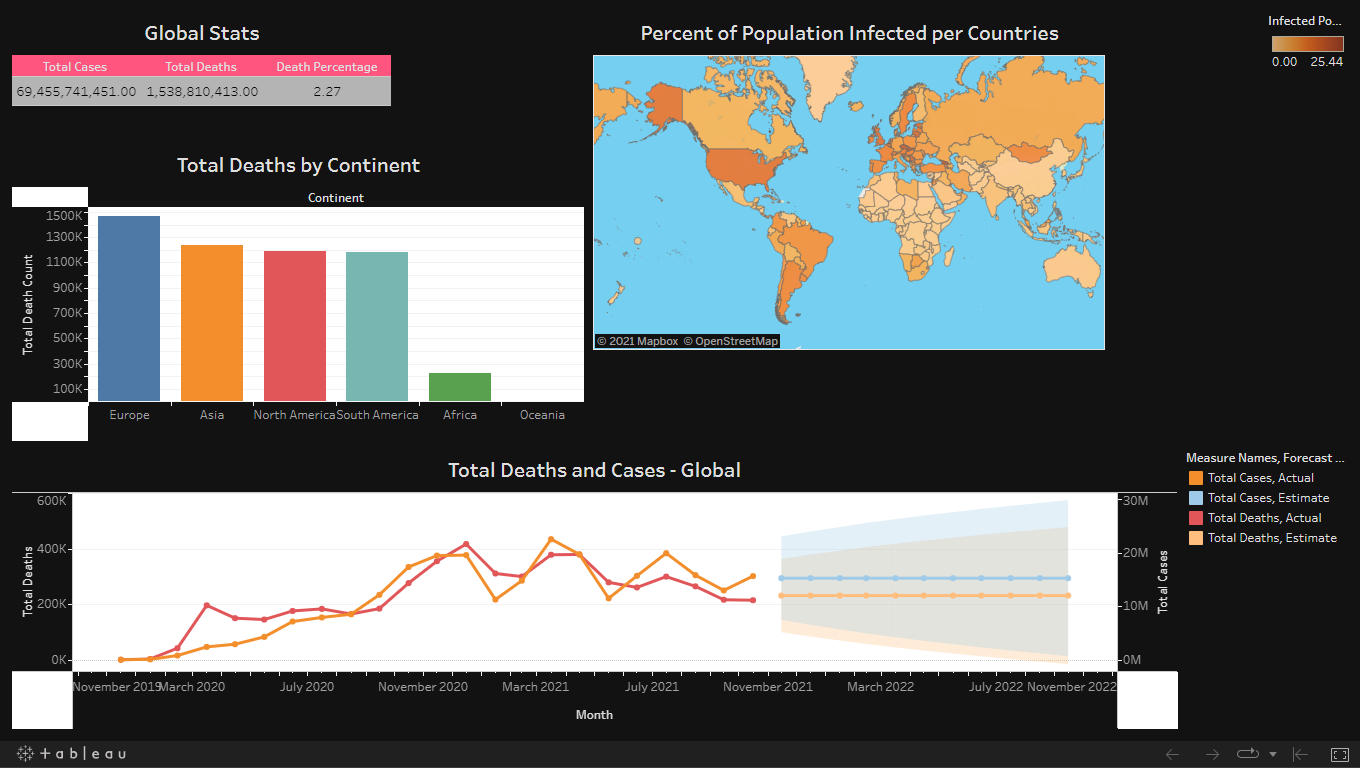
Overview: This dashboard is a representation of the SQL Project #1: Data Exploration - Covid, provides a clear way of seeing how the covid has evolved globally through out the months
-
Background: It's easier to extract insights and explain the data with a clear visualization of it, Tableau's Dashboards are excellent to do so.
