This is a tool based on Graphviz for graphically illustrating a Finite Markov Decision Process (FMDP).
This is a fork from https://github.com/rmattila/MDP-Explore The original project aimed at graphs of the Markov chain underlying the Markov Decision Process (MDP), and did not support action nodes.
I also created the fork to support Python 3 and above and provided some installation advice.
Aldebaro. March 2024
Requirements: graphviz and wxPython. You also need numpy and scipy.
Using Conda on Windows, one can create an environment with these dependencies by running conda create --name fmdp --file .\environments.txt on the project root folder and activate it by running conda activate fmdp.
Alternatively, one can also install the require packages in a conda environment using conda install graphviz python-graphviz wxpython numpy scipy. I recommend using Python 3.7.1.
Pedro, March 2024.
First, define the transition probabilities of the MDP in mdp.py along with the
number of actions and the state labels. A variant of the standard machine
replacement problem is provided as an example in the file.
To run the code, use pythonw main.py.
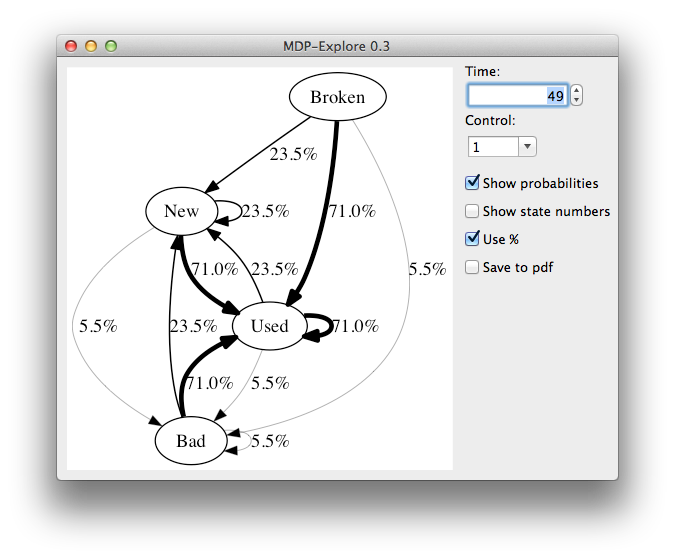
The states will be plotted along with the transitions. If Show probabilities is enabled, then the transition probabilities will be added as labels to the transitions. The thicknesses of the arrows is proportional to the transition probabilities. You can choose which action and time that should be used to evaluate the transition matrix.
The current plot is saved and can be found in the img/ folder.