CaloriNet: From silhouettes to calorie estimation in private environments
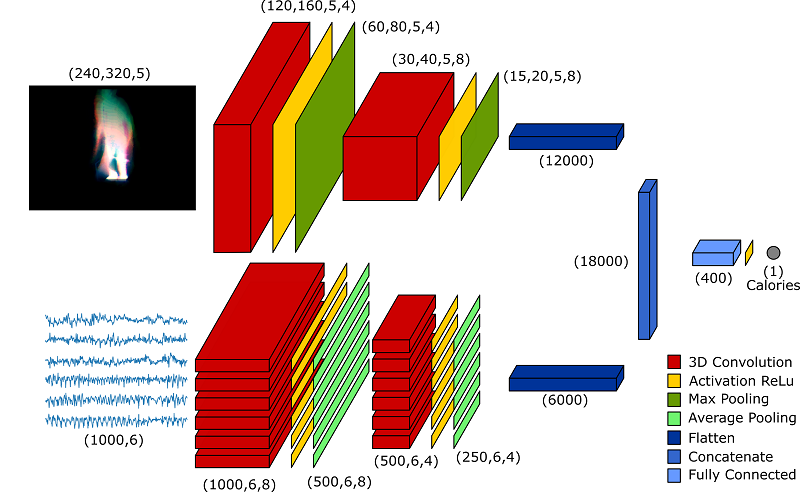
We propose a novel deep fusion architecture, CaloriNet, for the online estimation of energy expenditure for free living monitoring in private environments, where RGB data is discarded and replaced by silhouettes. Our fused convolutional neural network architecture is trainable end-to-end, to estimate calorie expenditure, using temporal foreground silhouettes alongside accelerometer data. The network is trained and cross-validated based on a publicly available dataset, SPHERE-Calorie, linking RGB-D, inertial and calorific measurements. Results show state-of-the-art minimum error on the estimation of energy expenditure (calories per minute), outperforming alternative, standard and single-modal techniques.
Content and pipeline
In order to reproduce our results, the following pipeline should be followed:
- Download the SPHERE-Calorie dataset. A data request form must be filled in to download the data.
- Unzip all the
depth.zip,rgb.zipandlabel.zipcontained in eachSubject*_Record*folder - Run OpenPose on all the RGB images of each subject to find the skeleton joints
- Run
generate_silhouettes_rgbd.mto convert the RGB images into silhouettes - Run
generate_avg_silhouette.pyto create the time-averaged silhouettes - Run
create_files_crossvalidation_CaloriNet.pyto create the training files for the cross validation. Ten different files will be created, each one is already configured for cross-validation on a different subject. - Run all the
CaloriNet_leave_*_out.pyfiles to train the 10 different networks used for cross-validation - Run
plot_results_CaloriNet.pyandplot_final_results.pyto display the results
Description of files
The following files are provided:
generate_silhouettes_rgbd.m: Matlab script used to convert RGB images into silhouettesgenerate_avg_silhouette.py: Python script to create multi-scale temporale silhouettes (the network input)create_files_crossvalidation_*.py: Available for CaloriNet, SiluCalNet and AccuCalNet, script that generates the cross-validation training networkstemplate_validation_*.py: The template file used by the above scriptplot_final_results.py: Plot the final figure comparing all the results together
Additional files:
ImgCache.py: Support class forgenerate_avg_silhouette.pyto read images into memory using a cacheCaloriesDataset.py: Set of Python functions used to read the.npzarchives containing the pre-processed datasetinvestigate_dataset.py: Displays a figure of the calories dataset (as shown in the paper)NetworkArchitectures.py: Python script containing all the network architectures used in the paperplot_crossvalidation_loss.py: Plot the training and validation loss for each networkplot_error_vs_buffersize.py: Plot the error vs the buffersize (as shown in the paper)plot_prediction_case.py: Plot a figure with the comparison between the ground truth and the calories prediction for different algorithms (as shown in the paper)PlotLearning: Keras callback function to show training and validation losses during trainingSaveHistory.py: Keras callback function to save the history of training and validation losses
Generation of silhouttes from RGB images
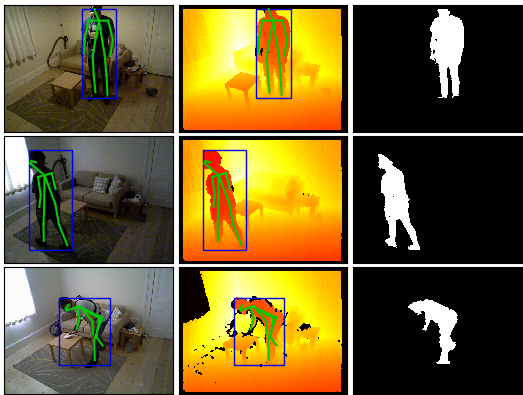
Before generating the silhouettes, the RGB images in the dataset must be processed with OpenPose to detect skeleton joints. Once skeletons are detected, silhouettes are generated with the matlab script generate_silhouettes_rgbd.m. Simply edit the script to adjust your data path and run it in Matlab. The script will generate a new folder for each subject in the dataset containing silhouettes in .png format.
Generation of multi-scale temporal silhouettes
As described in the paper, the input of the network is constituted by time-averaged silhouettes. This task is performed by generate_avg_silhouette.py. This script reads the calories file and for each calorie measurement selects a buffer of silhouettes which are averaged together. The output of this script is a set of .npz files which are used for training the networks. To work with this archives, a few functions are provided in the CaloriesDataset.py file.
Cross-validation
To replicate the results shown in the paper, 10 different networks must be trained. Each network is trained on 9 subjects and validated on the 10th. To allow the use of HPC clusters, the script provided in create_files_crossvalidation_CaloriNet.py automatically creates the 10 different files used for training. The files are based on the template template_validation_CaloriNet.py, with the training and testing data automatically adjusted. Together with the training files, the create_files script also generates some bash script files that can be used to submit the jobs on an HPC cluster.
Plotting the results
In order to test the network and predict the calorie estimation, the file plot_results_CaloriNet.py should be used. This script loads all the trained networks and test them one by one, producing a plot of the measured vs. estimated calories burnt. In addition to this, a .dat file containing a summary of the results is saved as well. This file is used in plot_final_results.py to generate the final figure containing a comparison of all the methods.
AccuCalNet and SiluCalNet
The above pipeline can be easily adjusted to replicate the results for AccuCalNet and SiluCalNet. Simply follow the above steps running the _AccuCalNet or _SiluCalNet as needed.
Results
Citation
Please cite this paper in your work if it helps your research:
@inproceedings{masullo2018calories,
  author = {Alessandro Masullo and Tilo Burghardt and Dima Damen and Sion Hannuna and Victor Ponce-Lopez and Majid Mirmehdi},
  booktitle = {BMVC},
  title = {CaloriNet: From silhouettes to calorie estimation in private environments},
  year = {2018}
}


