luctools provides a toolset for plotting, detrending and calculating period and phase of luciferase based circadian expression experiments.
To improve the ease of use and reproducibility of analysing circadian luciferase time series.
-
Plotting of time series with mean and CIs calculated across replicates.
-
Detrending of signal for both decay and baseline.
-
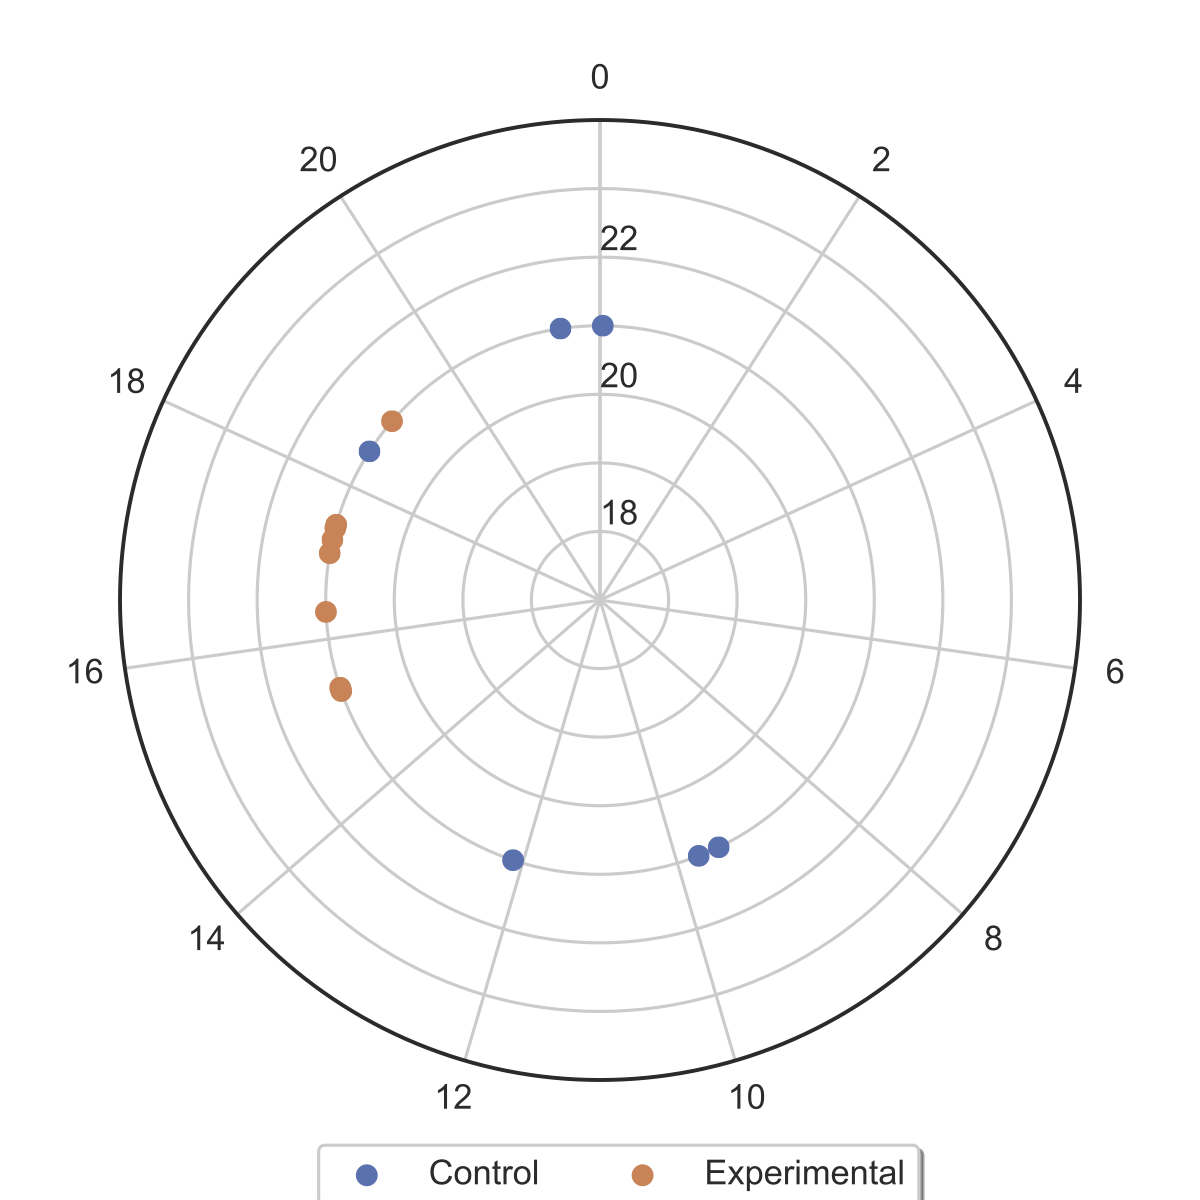
Calculation and plotting of period and phase.
from luctools import analyse

#reads in data and sampling rate of experiment (samples/hour)
data = analyse.luctraces(path_to_input_data,sample_rate)
#plots undetrended data
data.gen_tsplot(output_path)
#detrends data
data.detrend()
#plots detrended data
data.gen_tsplot(output_path)#calculates periods of each time series
data.get_periods()
#calculates phases of each time series
data.get_phases()
#plots period vs phase for each time series
data.gen_phase_plot(output_path)luctools expects input files to be formatted as comma seperated. The first column should index the observations. The header should start with any string and the rest of the header should contain the genotype of the observations in the column. Replicates should have the same column headers.
| Frame | Control | Control | Control | Experimental | Experimental | Experimental |
|---|---|---|---|---|---|---|
| index# | data | data | data | data | data | data |
pip install luctools
-
Implement statistical comparison of phases between groups.
-
Improve phase determination.
-
Add API reference on readthedocs.
- numpy
- pandas
- scipy
- matplotlib
- seaborn
- peakutils
© 2018 Alexander M. Crowell: BSD-3


