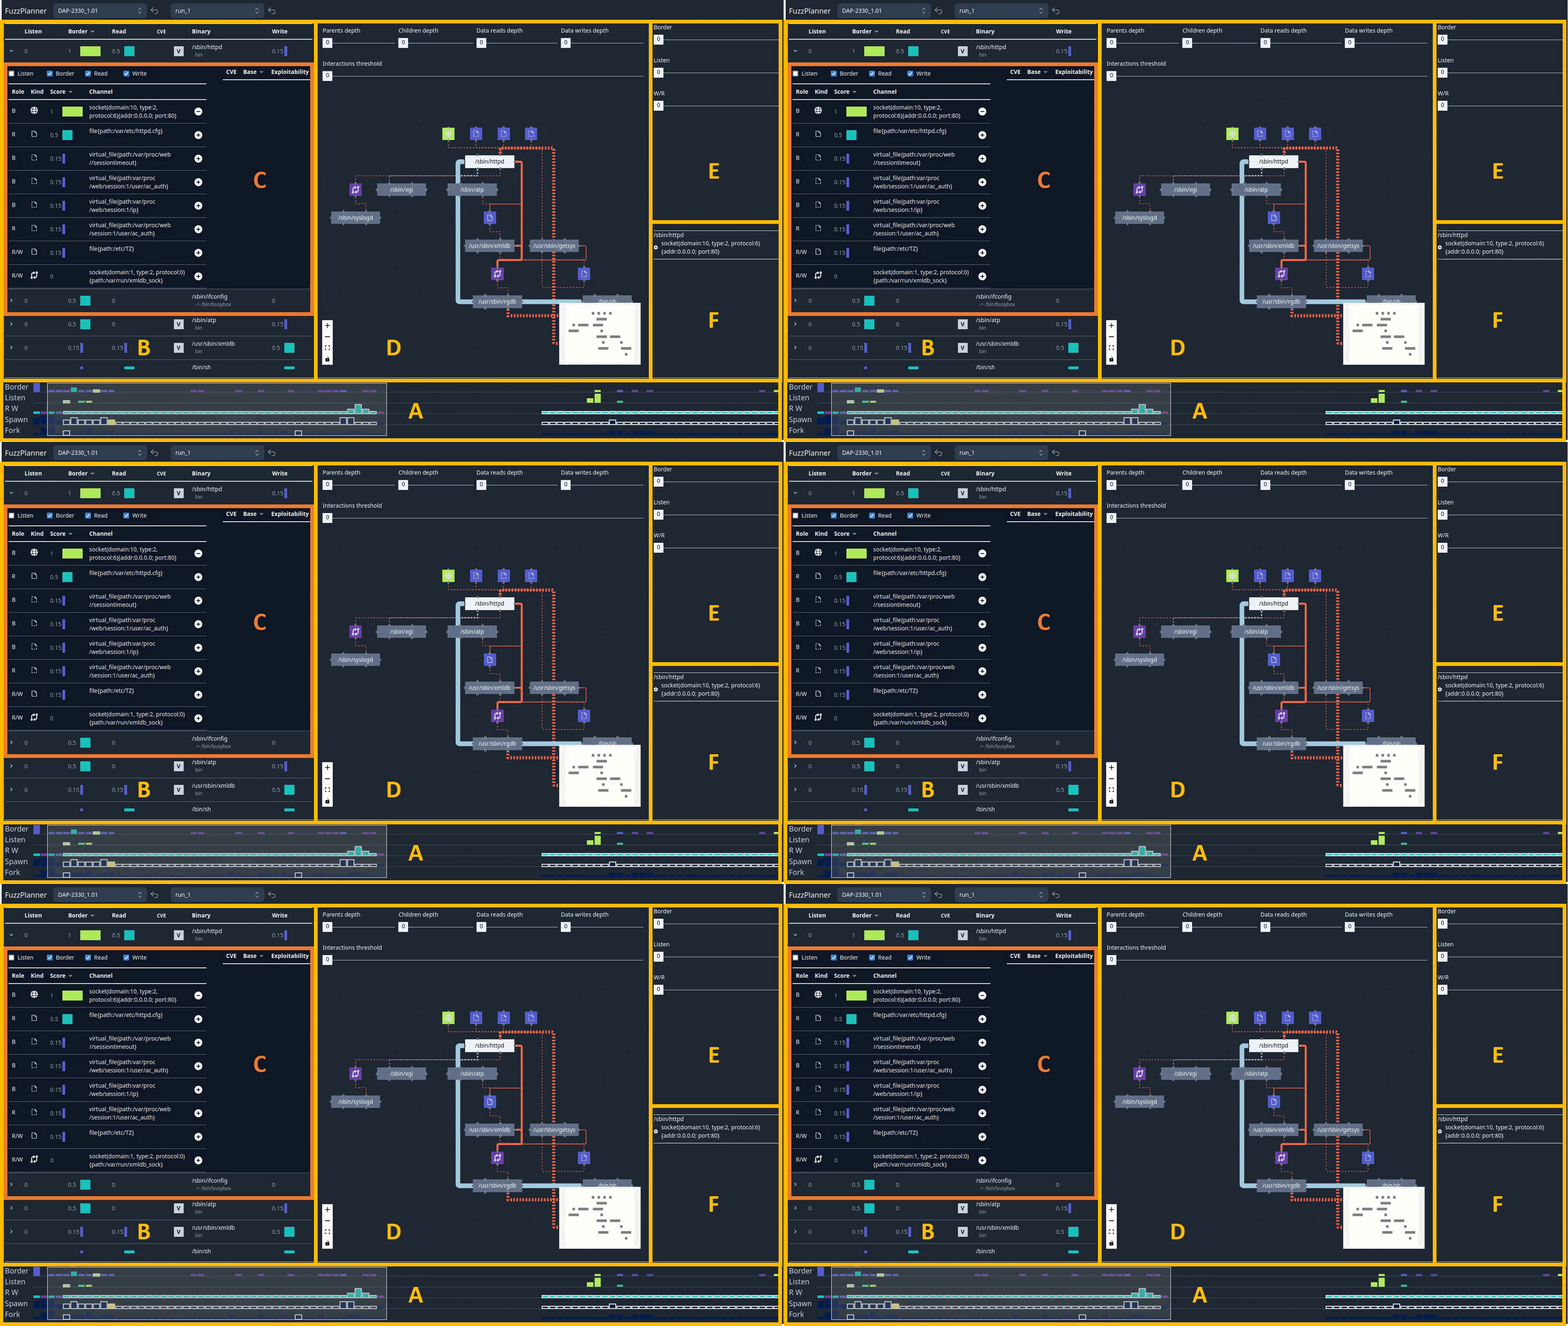
FuzzPlanner is a visual analytics solution designed to support security operators in the process of designing fuzzing campaigns for device firmware. By employing innovative visual aids, FuzzPlanner helps operators identify the most suitable targets for fuzzing. Our solution facilitates the understanding of various aspects including:
- Identifying the binaries executed by the firmware when emulated.
- Analyzing the interactions between different binaries.
- Identifying binaries that take inputs from the external world.
- Determining the input channels that can be selected for fuzzing.
The Timeline environment (A) provides a temporal overview of all data and process interactions collected during the emulation. This environment helps users analyze the temporal behavior of the emulation. Key features include:
- Time Bins: Interactions are grouped into time bins, allowing users to narrow their analysis to specific time intervals.
- Matrix Representation: The matrix represents different types of interactions, such as data interactions (border, listen, read, write, r+w) and process interactions (fork and spawn).
- Color Encoding: The color of cells encodes the highest score of data channels or base scores of CVEs, depending on the type of interaction.
- Brushing: Users can brush horizontally on the matrix to focus on specific time intervals.
- Highlighting: When a binary is selected, relevant bins for that binary are highlighted with a white border.
The Binaries Table environment (B) offers a table-based representation of all binaries executed during the emulation. This environment allows users to explore the binaries and prioritize them based on various criteria. Key features include:
- Columns: The table columns reflect interactions related to the binary (reads, binary attributes, writes).
- Data Interactions: Data interactions columns are represented as horizontal bar charts, indicating the highest score of the data channels involved.
- Binary Attributes: The table displays binary attributes such as type, vendor-specific status, and CVE base scores.
- Sorting: Users can sort the table based on different criteria.
- Filtering: The table can be filtered based on the selected time span from the Timeline and data channel score thresholds.
The Binary Pane environment (C) provides a detailed view of data channels used by a selected binary. Key features include:
- Table Representation: The table displays information about data channels, including how they are used, their type, score, and description.
- Experiment List: Users can add binary-channel pairs to the list of experiments to be planned.
- Filtering: Checkboxes allow users to filter interactions based on their type (e.g., border interactions).
- Vulnerabilities: The environment also lists all vulnerabilities (CVEs) affecting the binary.
The Binary Graph environment (D) complements the Binary Pane and displays the network of interactions centered around the selected binary. Key features include:
- Node-Link Representation: The graph uses a node-link representation, where nodes represent binaries and data channels, and edges represent their connections.
- Flow Representation: Data interaction edges are colored light-red, and process interaction edges are light-blue. The thickness of edges corresponds to the number of interactions.
- Interaction Flow: The graph helps users explore interactions from parent and child binaries, as well as data channels for reading and writing.
- Interactive Controls: Users can filter or expand the graph to explore interactions further.
The Filtering Pane environment (E) contains additional controls to filter the analyzed interactions based on their role and the score of data channels. Key features include:
- Interaction Role Filtering: Users can filter interactions based on their type (e.g., border, listen, read/write).
- Data Channel Score Thresholds: Users can set data channel score thresholds for interactions to be considered.
- Customizable Filtering: This environment allows users to customize the filtering of analysis data.
The Experiment Pane environment (F) contains the list of binary-channel tuples to be sent to the back-end to generate the fuzzing campaign execution plan. This environment is used to manage the planned experiments.
These coordinated environments within the FUZZPLANNER visual component help operators analyze and plan their fuzzing campaigns efficiently.
To use FuzzPlanner, please ensure that you have Docker installed.
To prepare the Docker image, follow these steps:
-
Open a terminal and navigate to the FuzzPlanner directory.
-
Run the following command:
sudo ./web.sh build-prod
sudo ./web.sh run-prod
You can interact with the FuzzPlanner visual component by browser on localhost:3000. You can analyze the emulation runs related to the firmware images: D-Link DAP-2330 version 1.01, D-Link DSL-2740R_UK version 1.01. The related runs have been obtained after the following operator's actions.
- The operator has run the firmware under a QEMU vm.
- Session 1: the operator has stimulated the firmware sending several HTTP web requests to the webserver httpd.
- The operator has paused the emulation.
- Automatically the information collected at run-time during the Session 1 have been stored into run_0.
- The operator has continued the emulation.
- Session 2: the operator has stimulated the firmware sending several commands to be executed to the remote shell telnetd.
- The operator has stopped the emulation.
- Automatically the information collected at run-time during the Session 2 have been added to those of the previous sessions (Session 1) and stored into run_1.
You can check out our article into paper directory.
- Coppa, Emilio, Alessio Izzillo, Riccardo Lazzeretti e Simone Lenti. "FuzzPlanner: Visually Assisting the Design of Firmware Fuzzing Campaigns." 2023 IEEE Symposium on Visualization for Cyber Security (VizSec). IEEE, 2023.
We are excited to present our findings and insights with the community at VizSec 2023 conference that will be held in Melbourne (Australia) on 22th October 2023.
