Newsroom Textual Analysis and Visualization Tools Built With R Shiny
Aleszu Bajak, John Wihbey, Gibby Free, Paxtyn Merten
While word cloud visualizations and similar types of simple tools are widely available on the web, the more sophisticated textual analysis software and code unfortunately remain the domain of experts and users of languages like R and Python. To address this, we created two prototypes that would allow newsrooms to harness the power of R’s textual and sentiment analysis packages in a simple drag-and-drop format through public-facing R Shiny apps. These two apps show how powerful data wrangling, analysis and visualization functions may be increasingly democratized for time-pressed journalists. We demonstrate use cases through: 1) exploratory analysis of public speeches; 2) exploration of sentiment analysis around large bodies of political advertising, such as the new archive on the Facebook platform; and 3) comparative analysis of one outlet’s coverage on a specific topic as compared to that of the competition.
R is an open-source statistical software environment with a robust community of developers that collaborate and share knowledge, tools and code.1 Newsrooms are increasingly adopting R. Currently, R has statistical and textual analysis packages that allow for rich and generative forms of interpretation. In addition, R Shiny, which deploys code and datasets to a server, is easily customizable and user-friendly; it allows for a text-and-numerical dataset to be dropped in and a set of questions to be asked of it, facilitated by a pre-coded operational workflow.
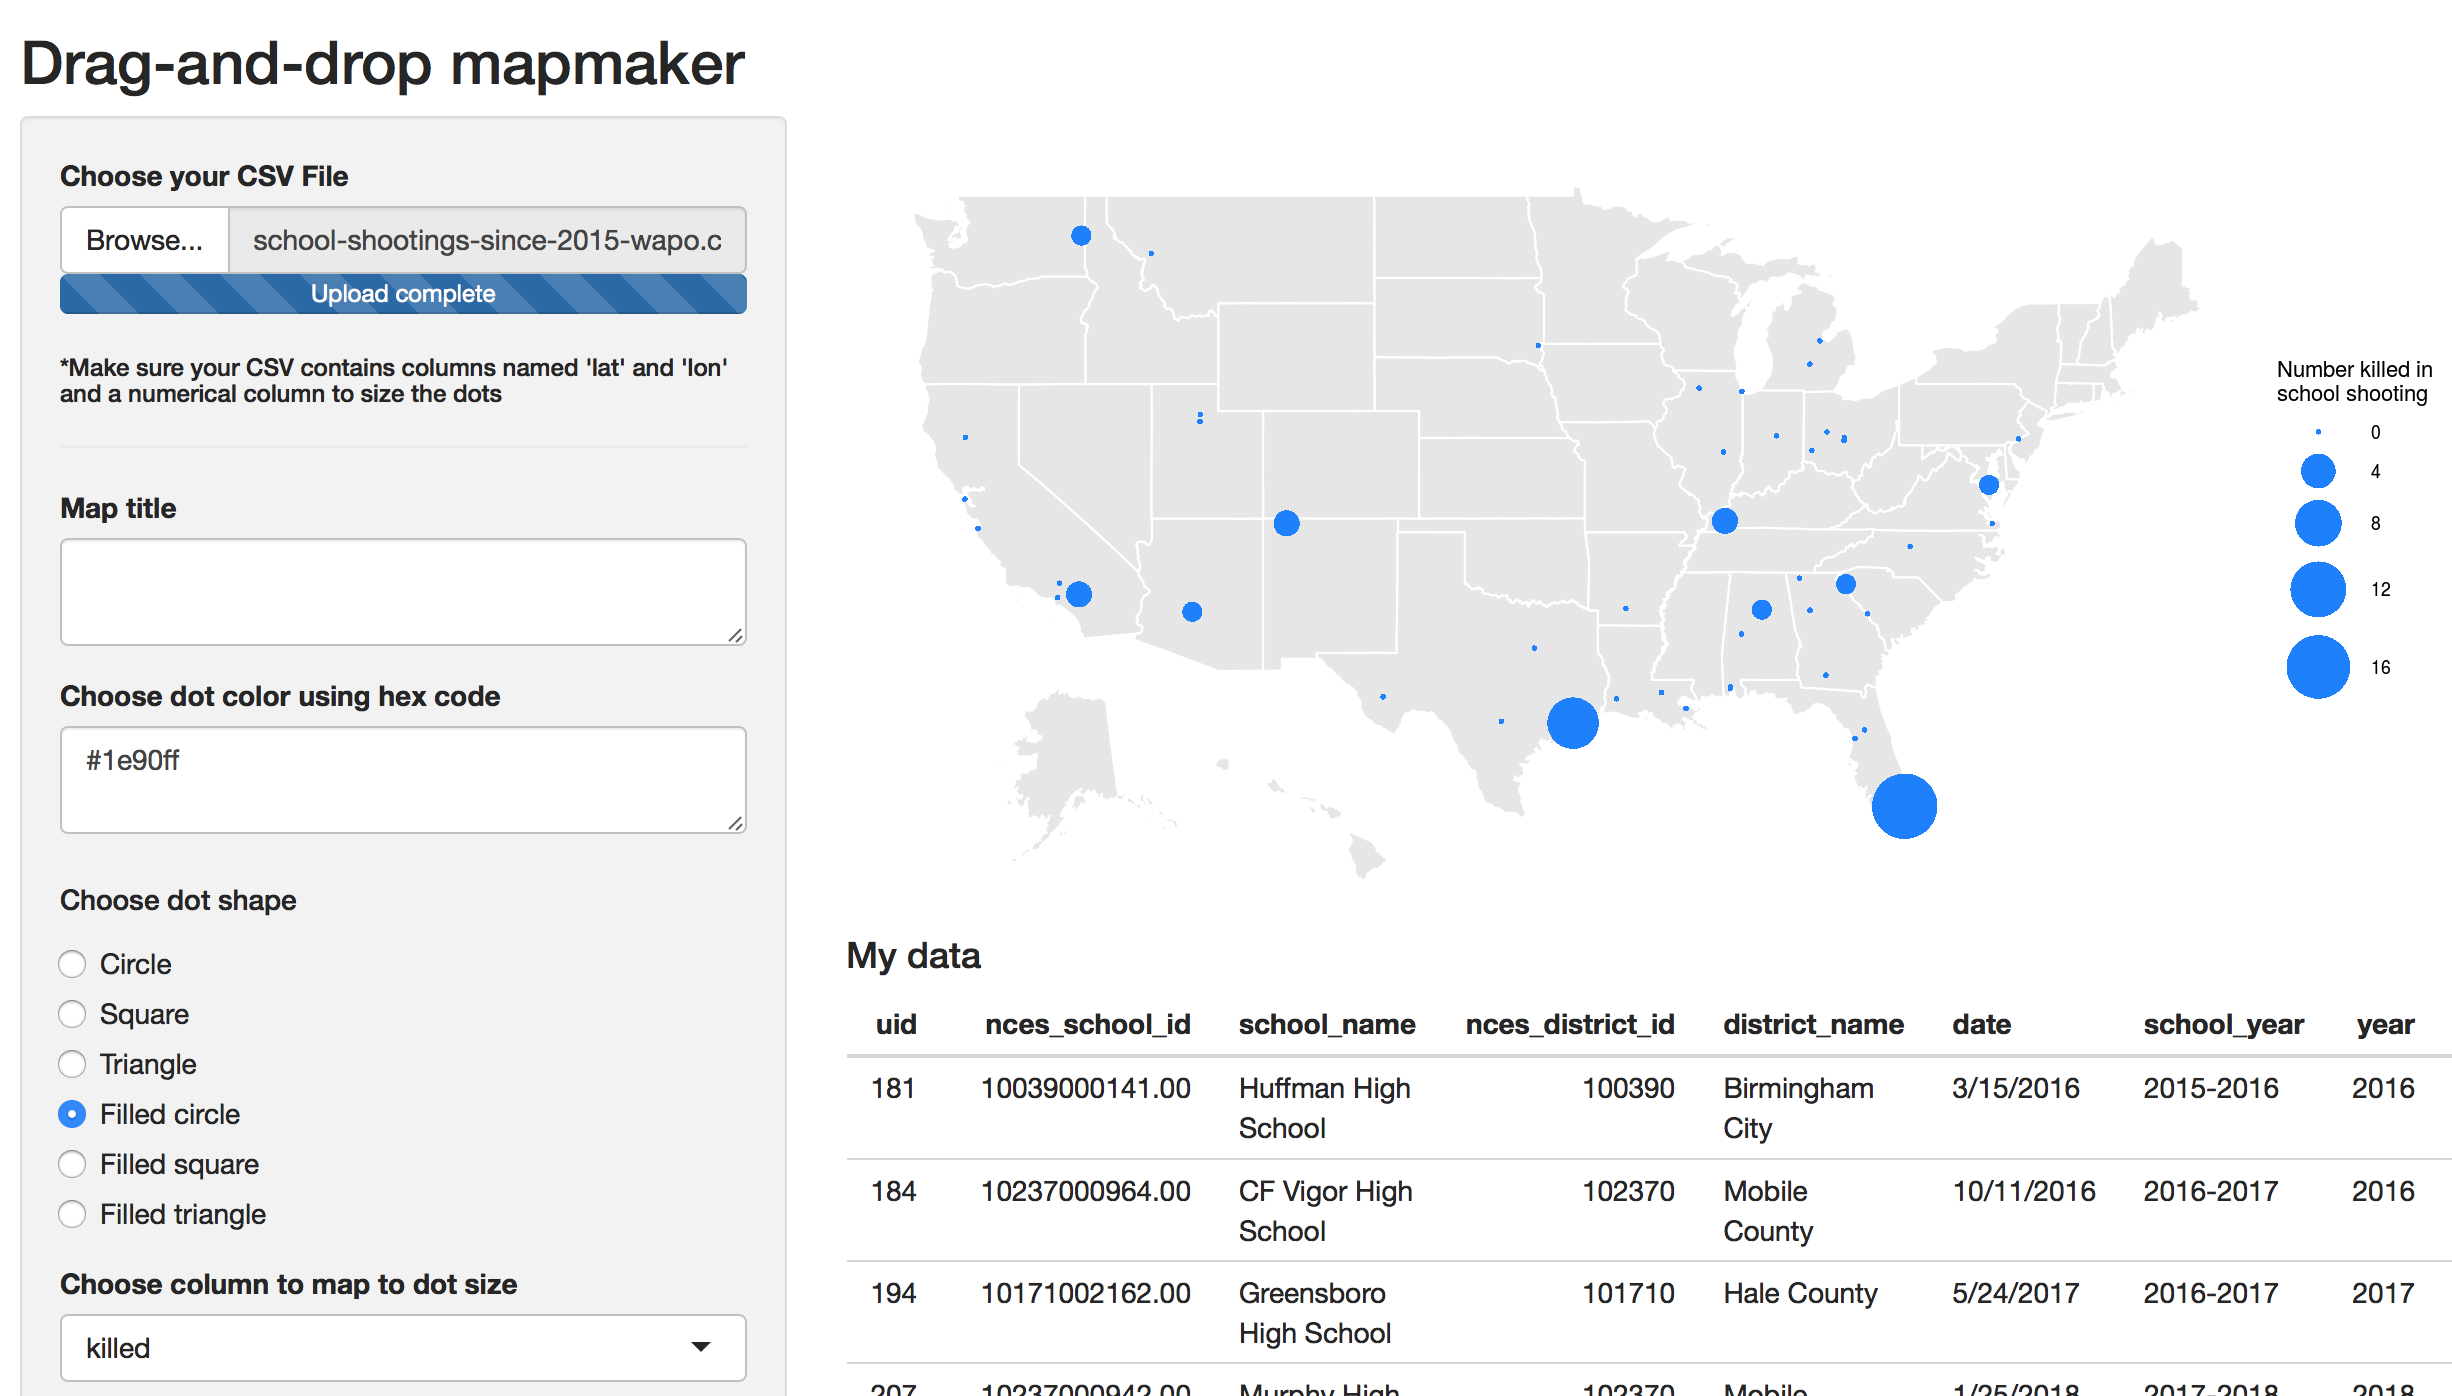
These apps would allow reporters to drop in spreadsheets or text documents of interest and ask a series of cross-cutting questions. In this project, we have customized R’s “tidytext” and “plotly” packages and UVM’s “LabMTsimple” sentiment dictionary for textual and sentiment analysis and added several intervention points for users to subset the data, ask it guided questions and produce exploratory data visualizations.
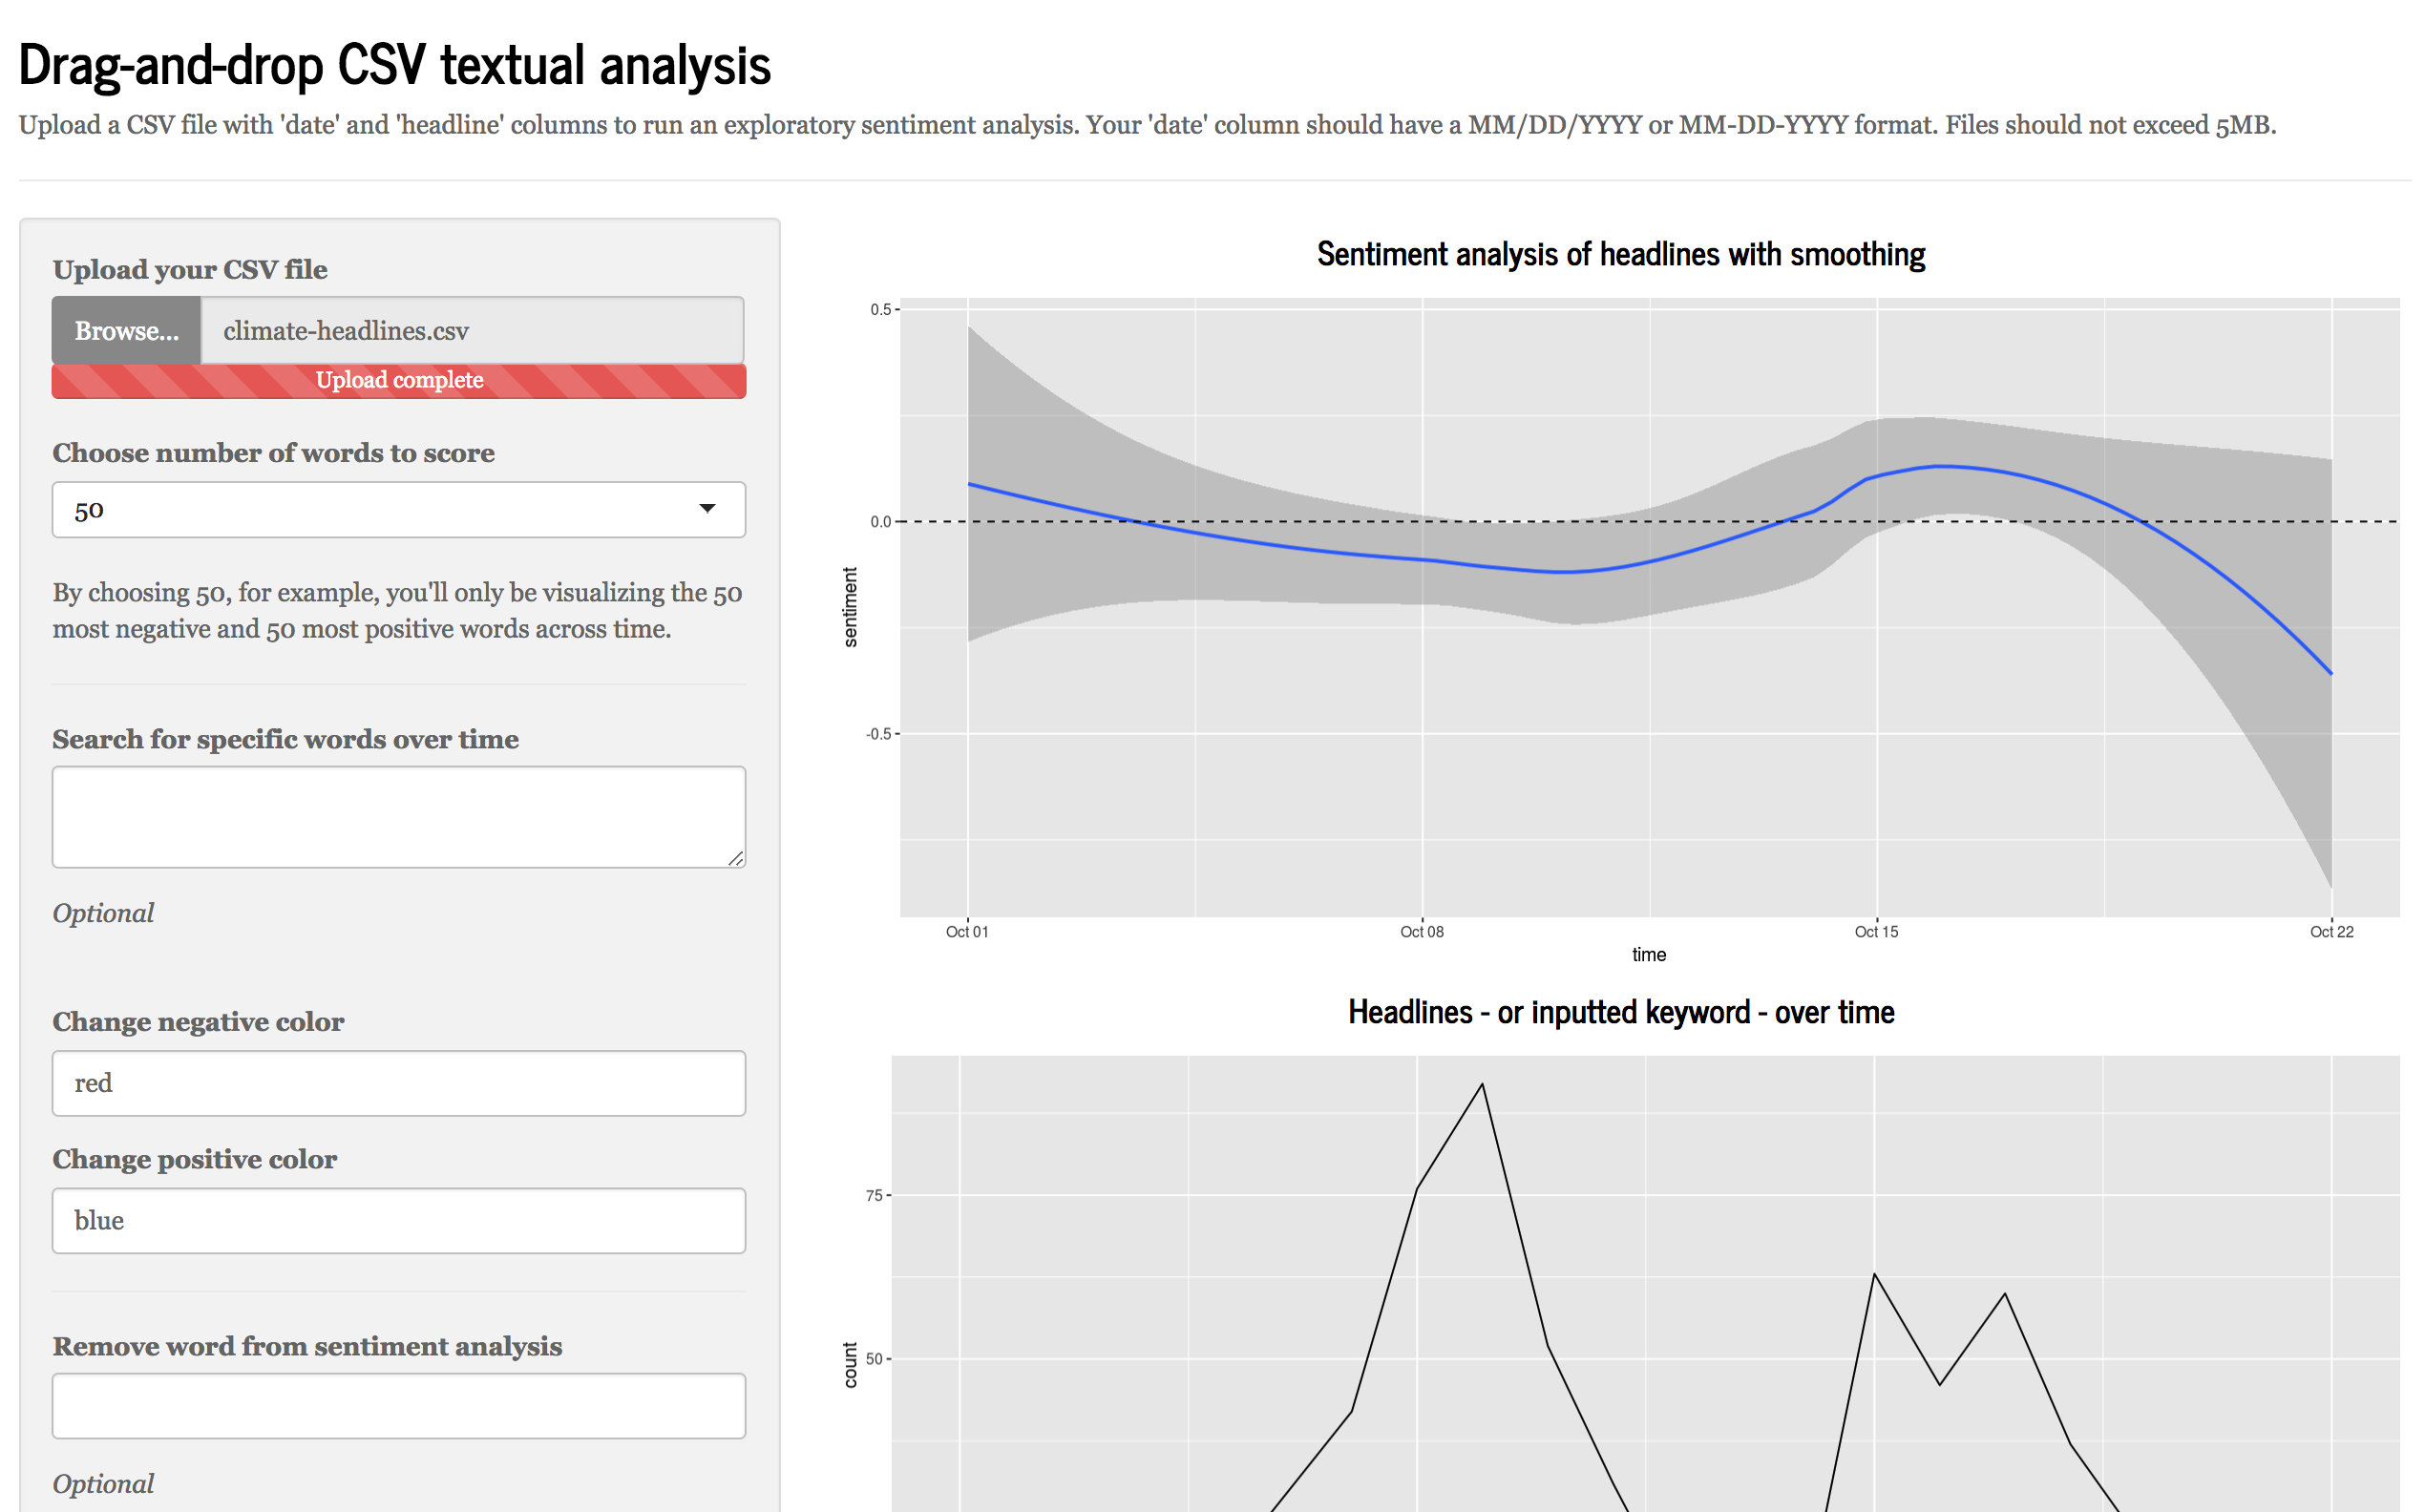
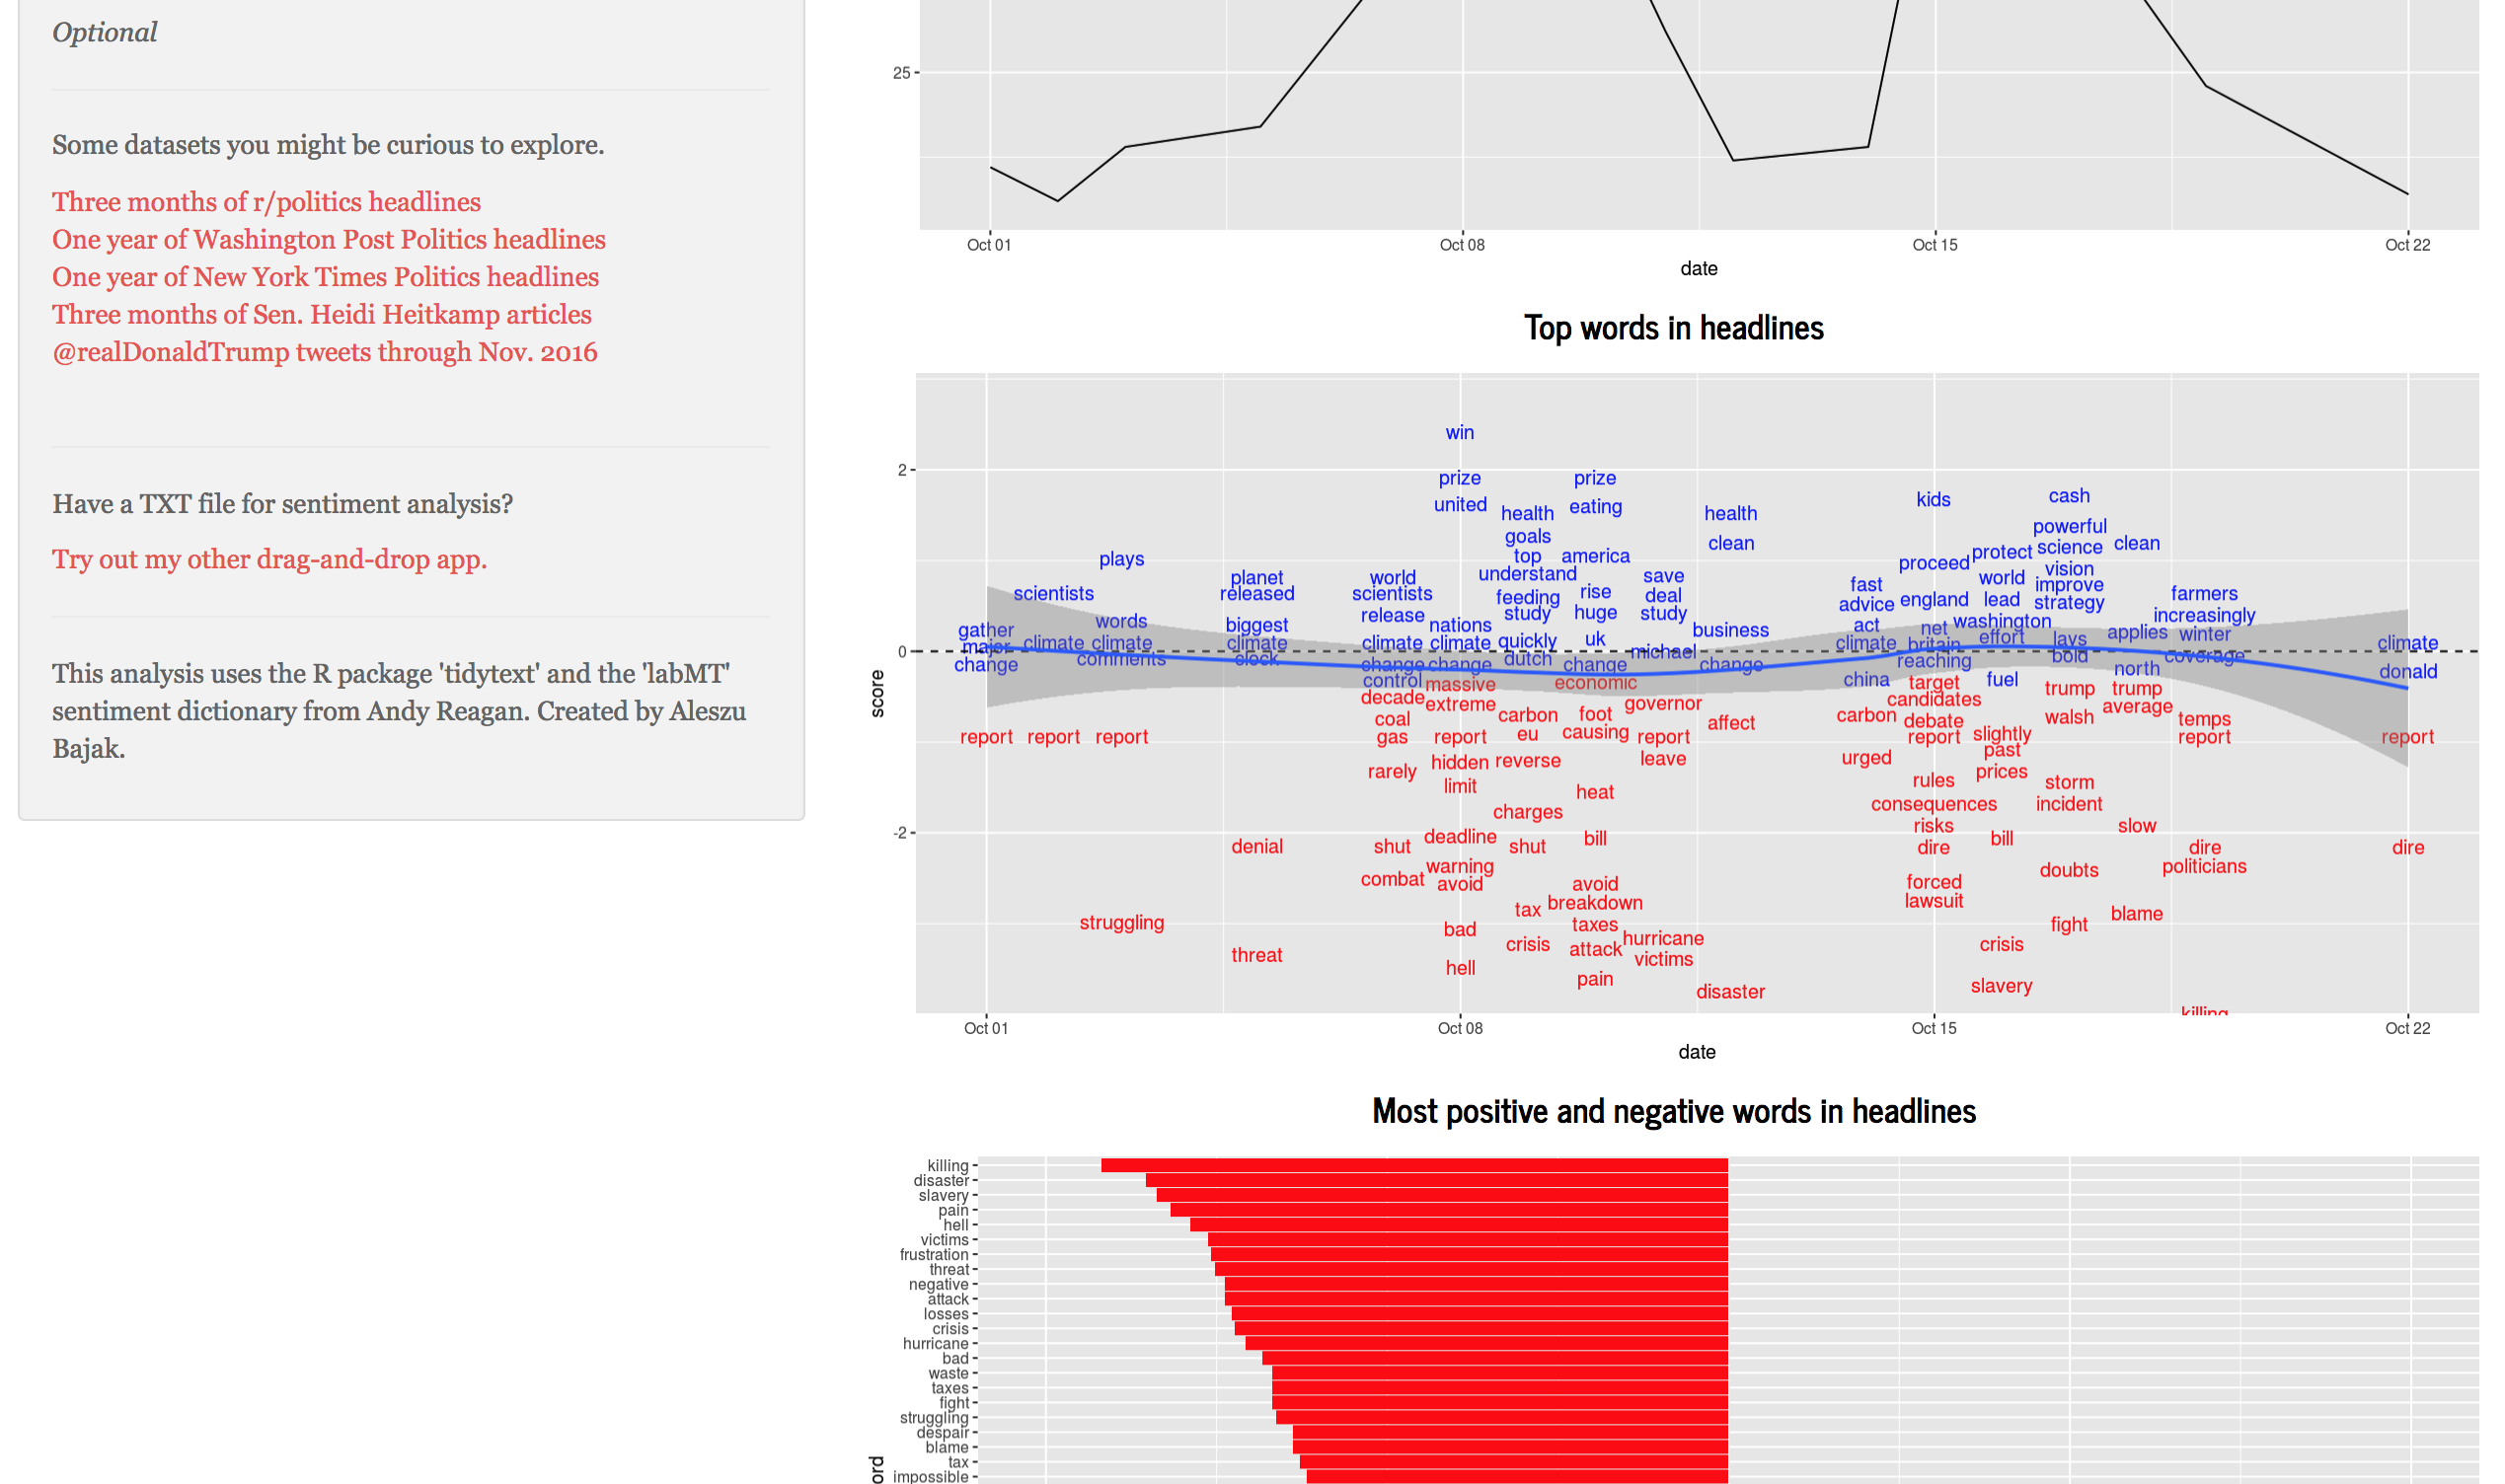
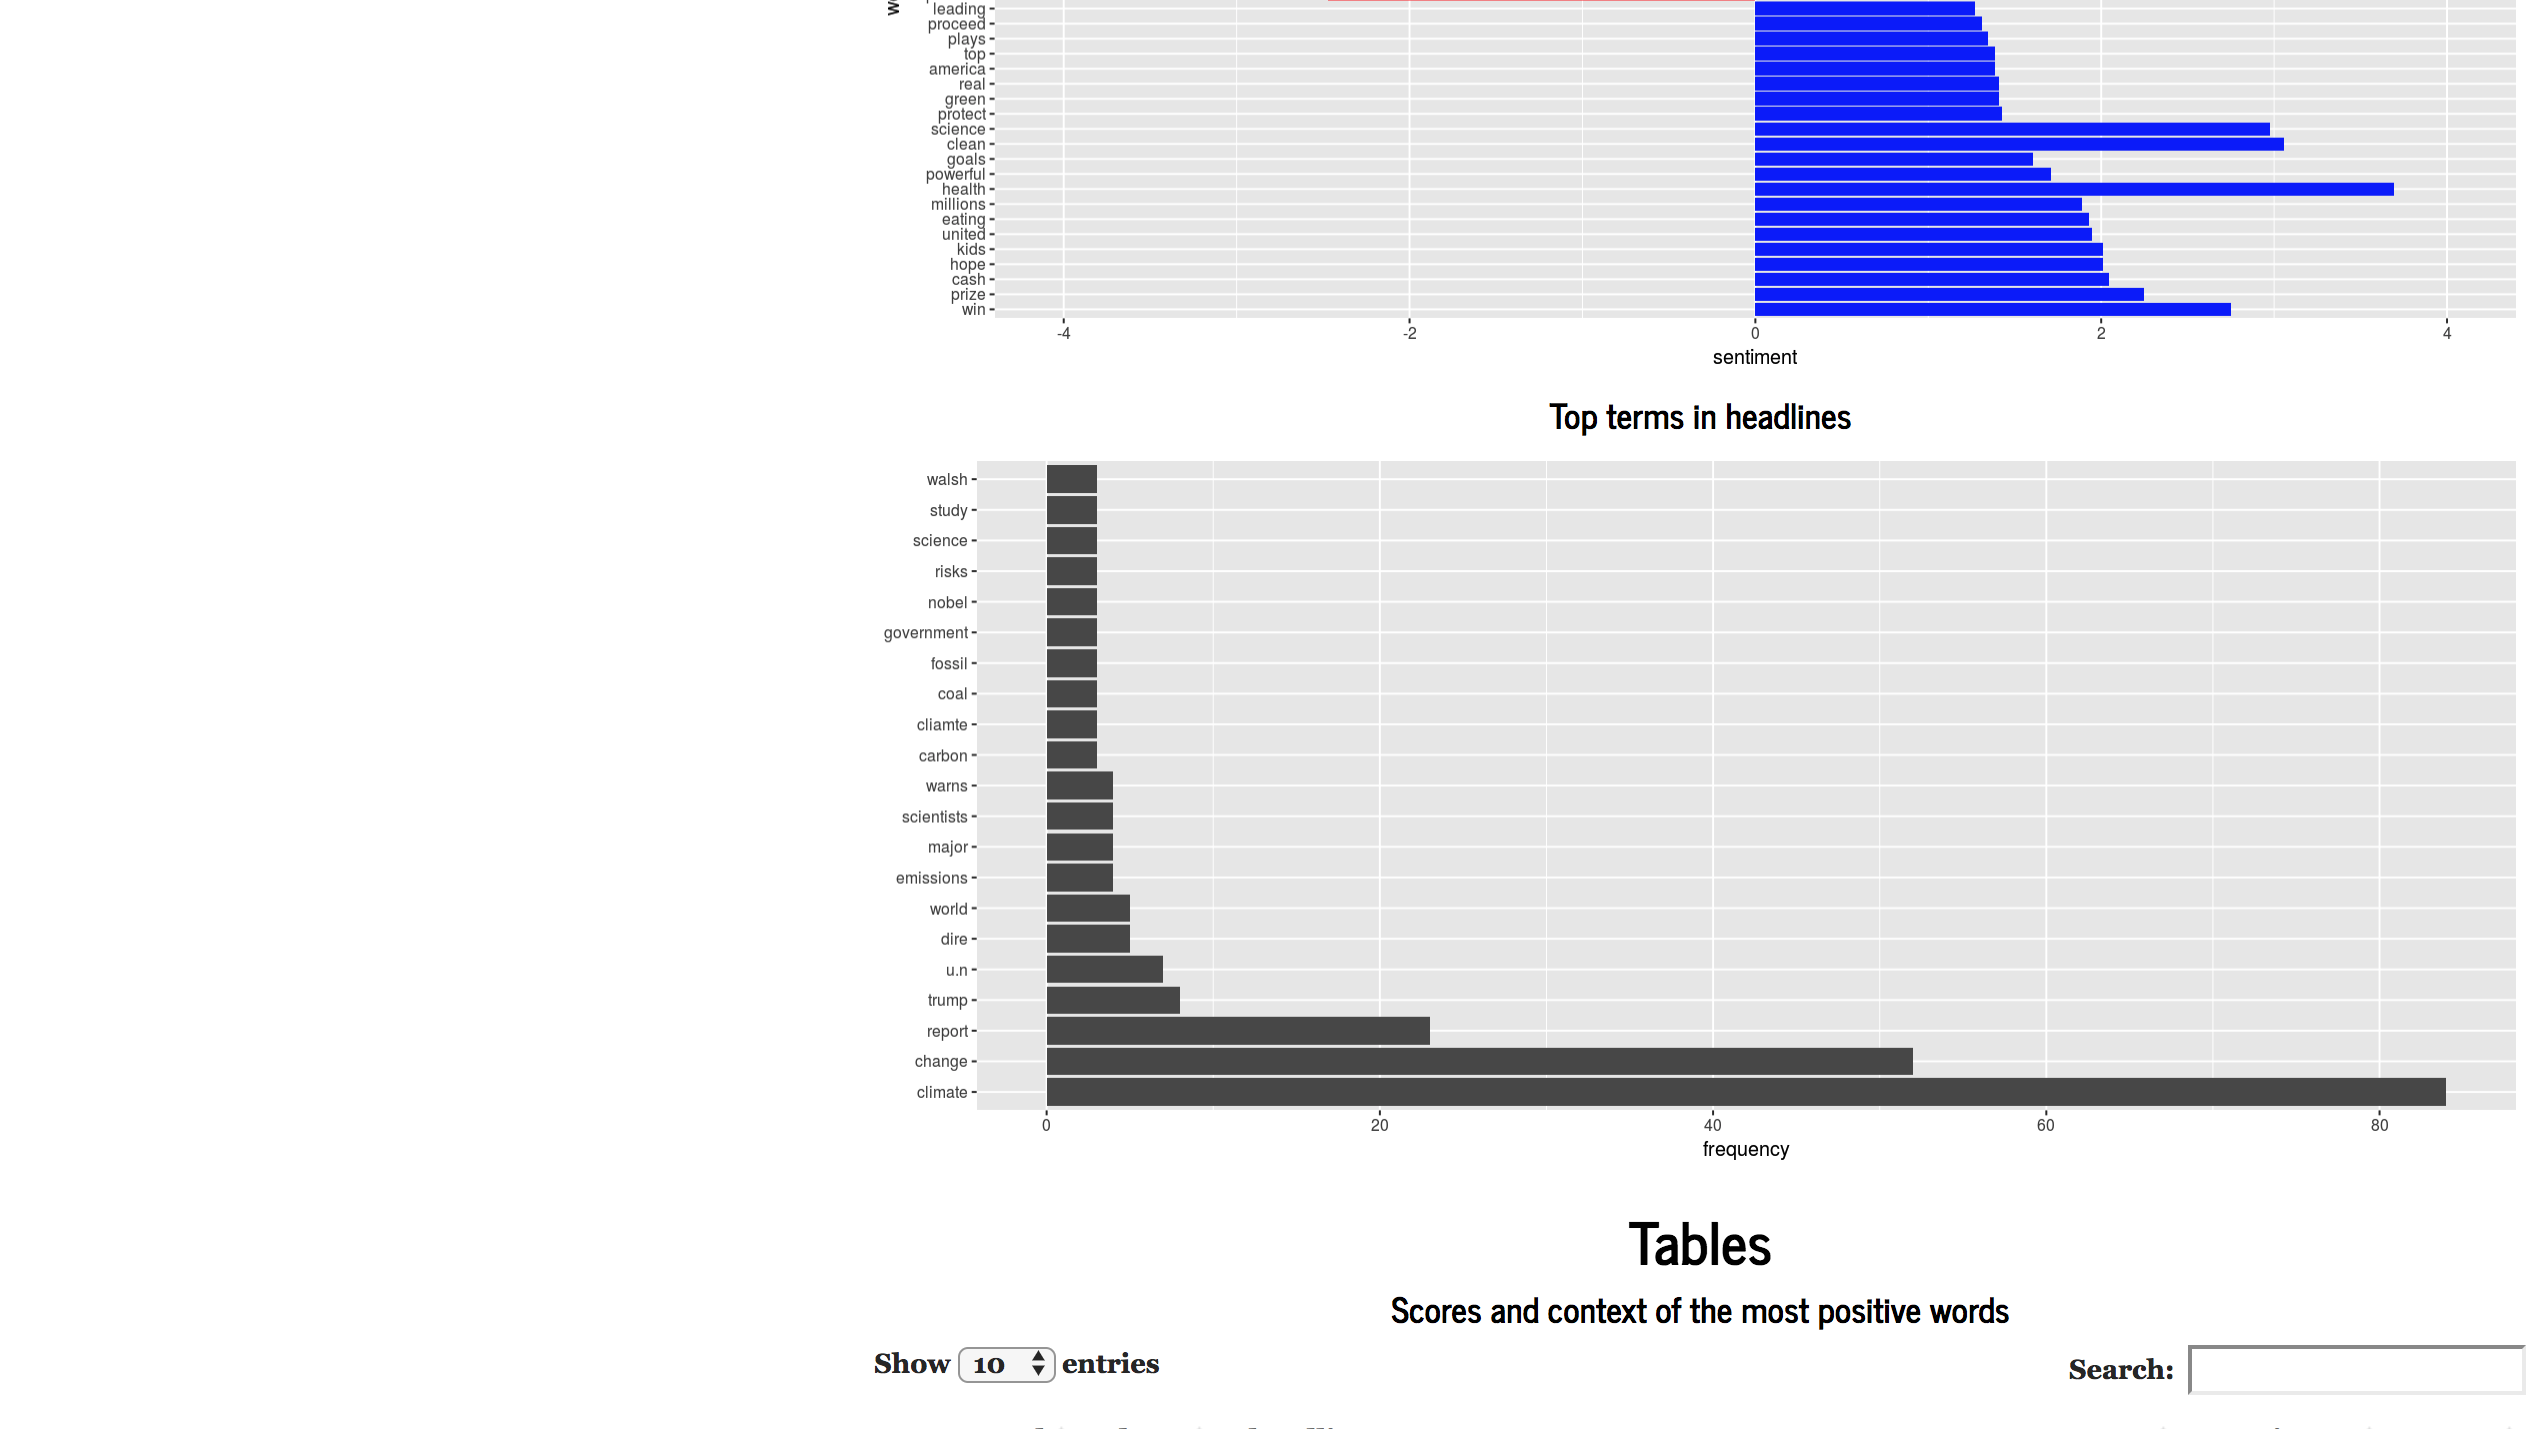
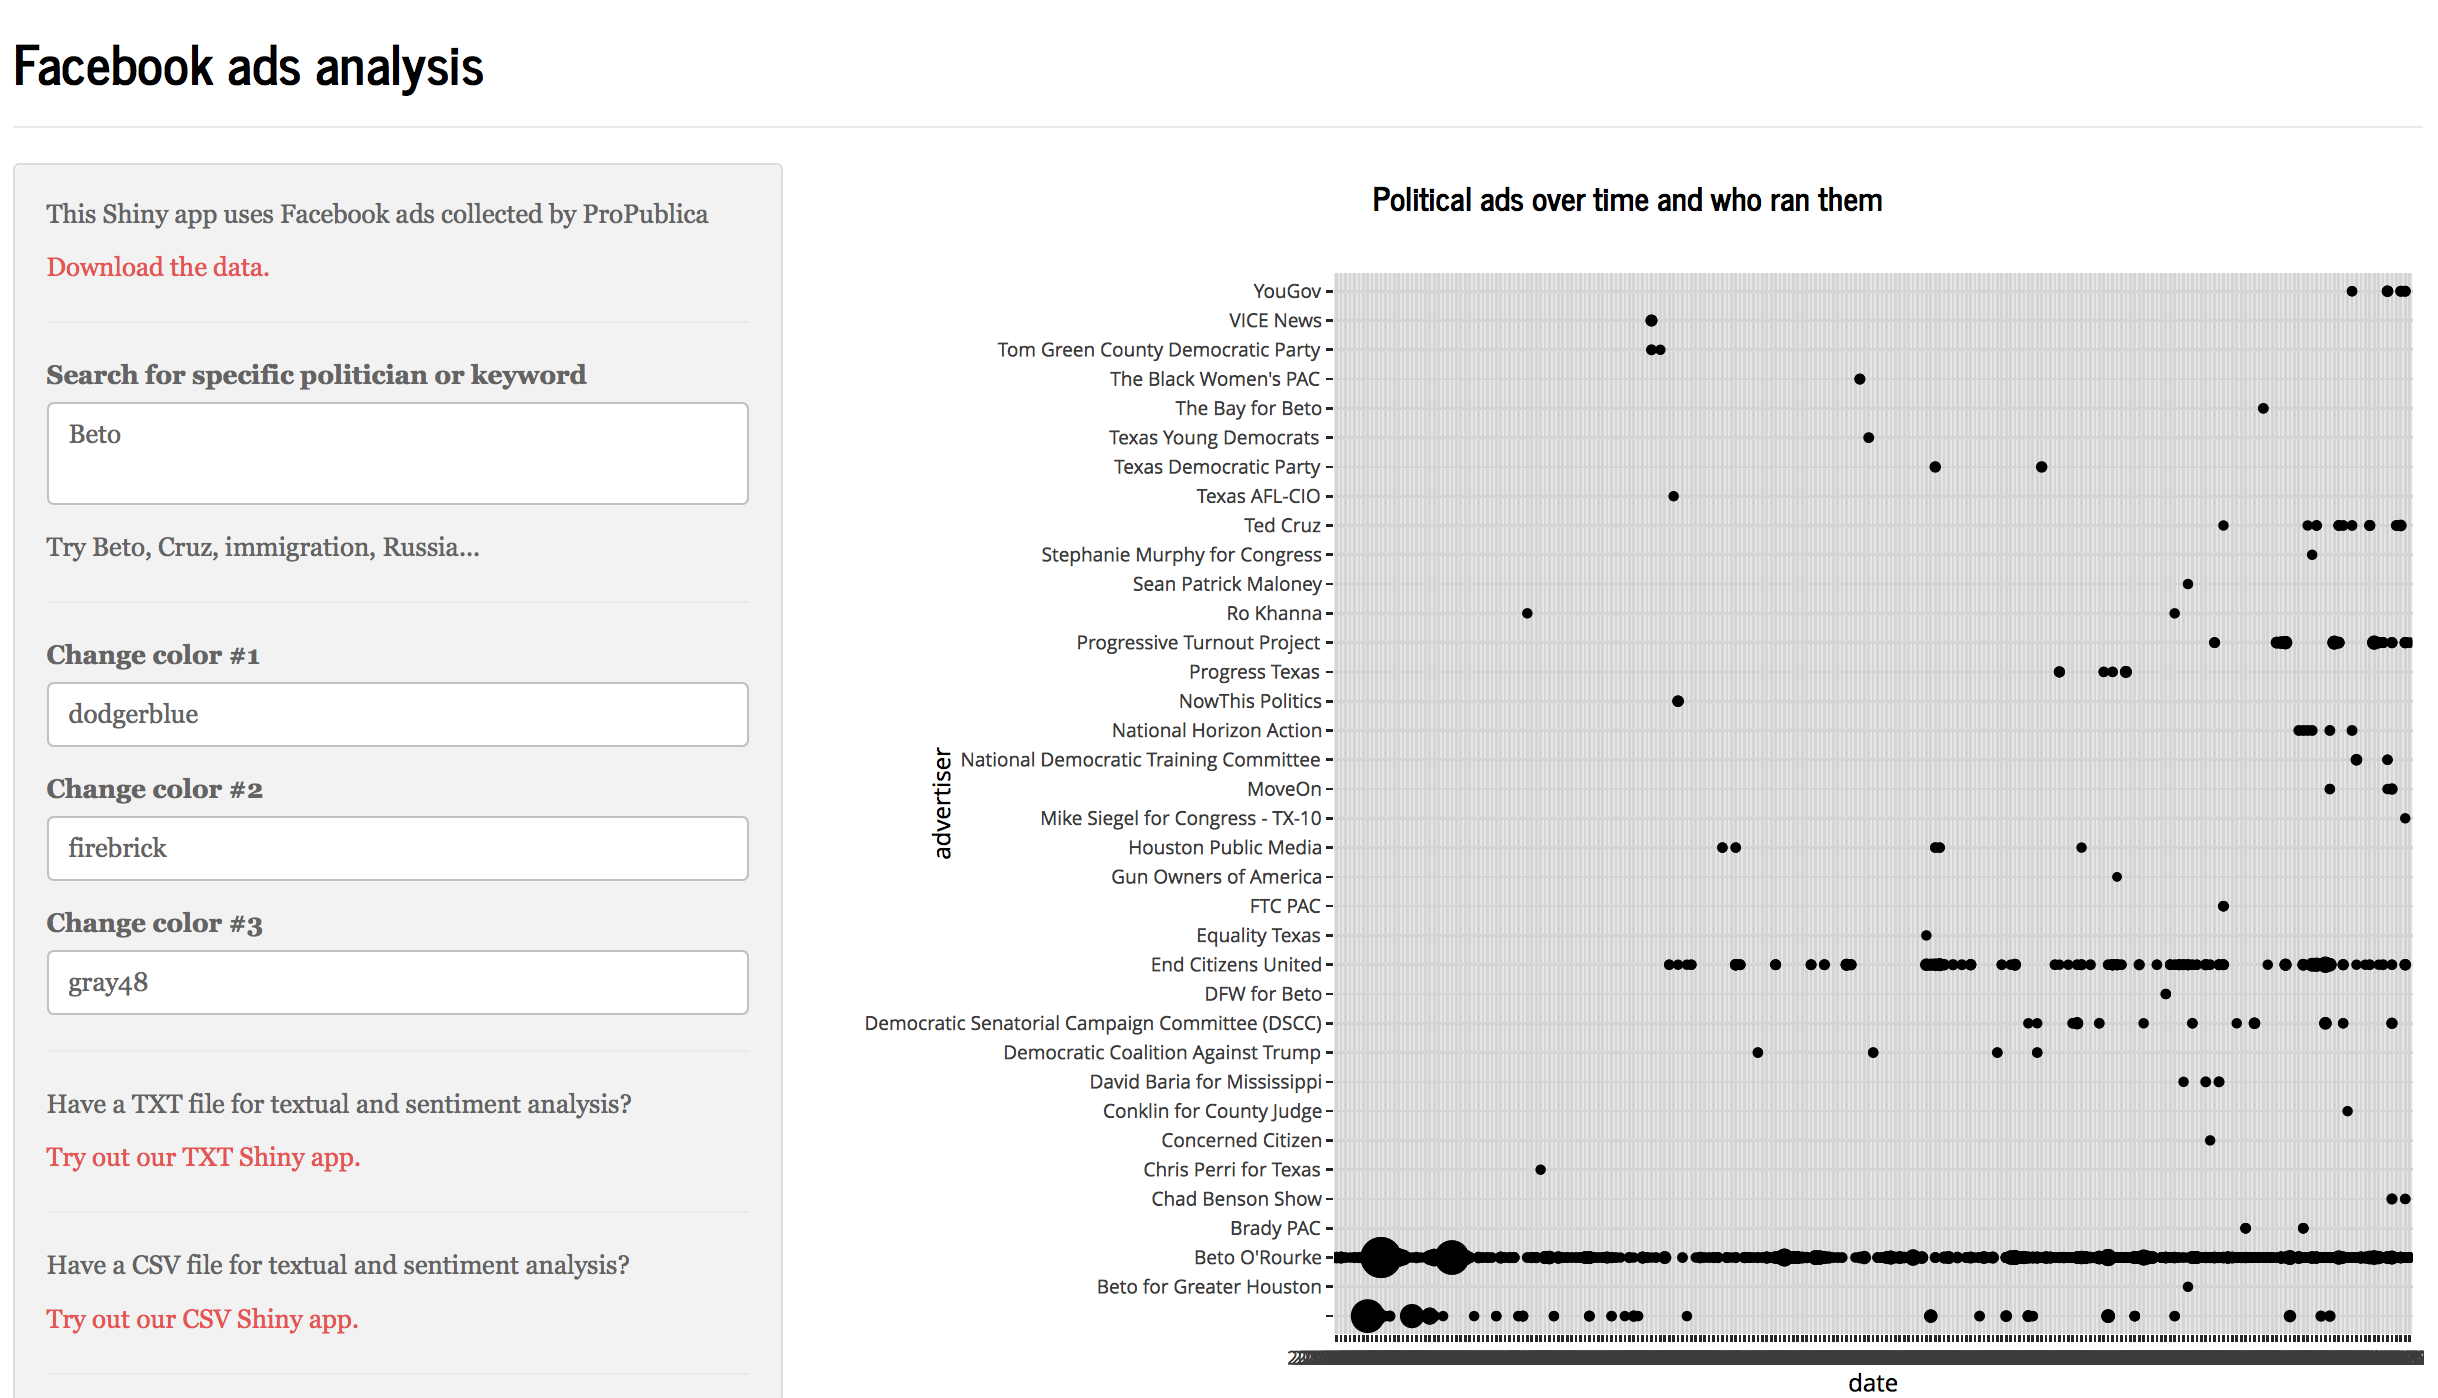
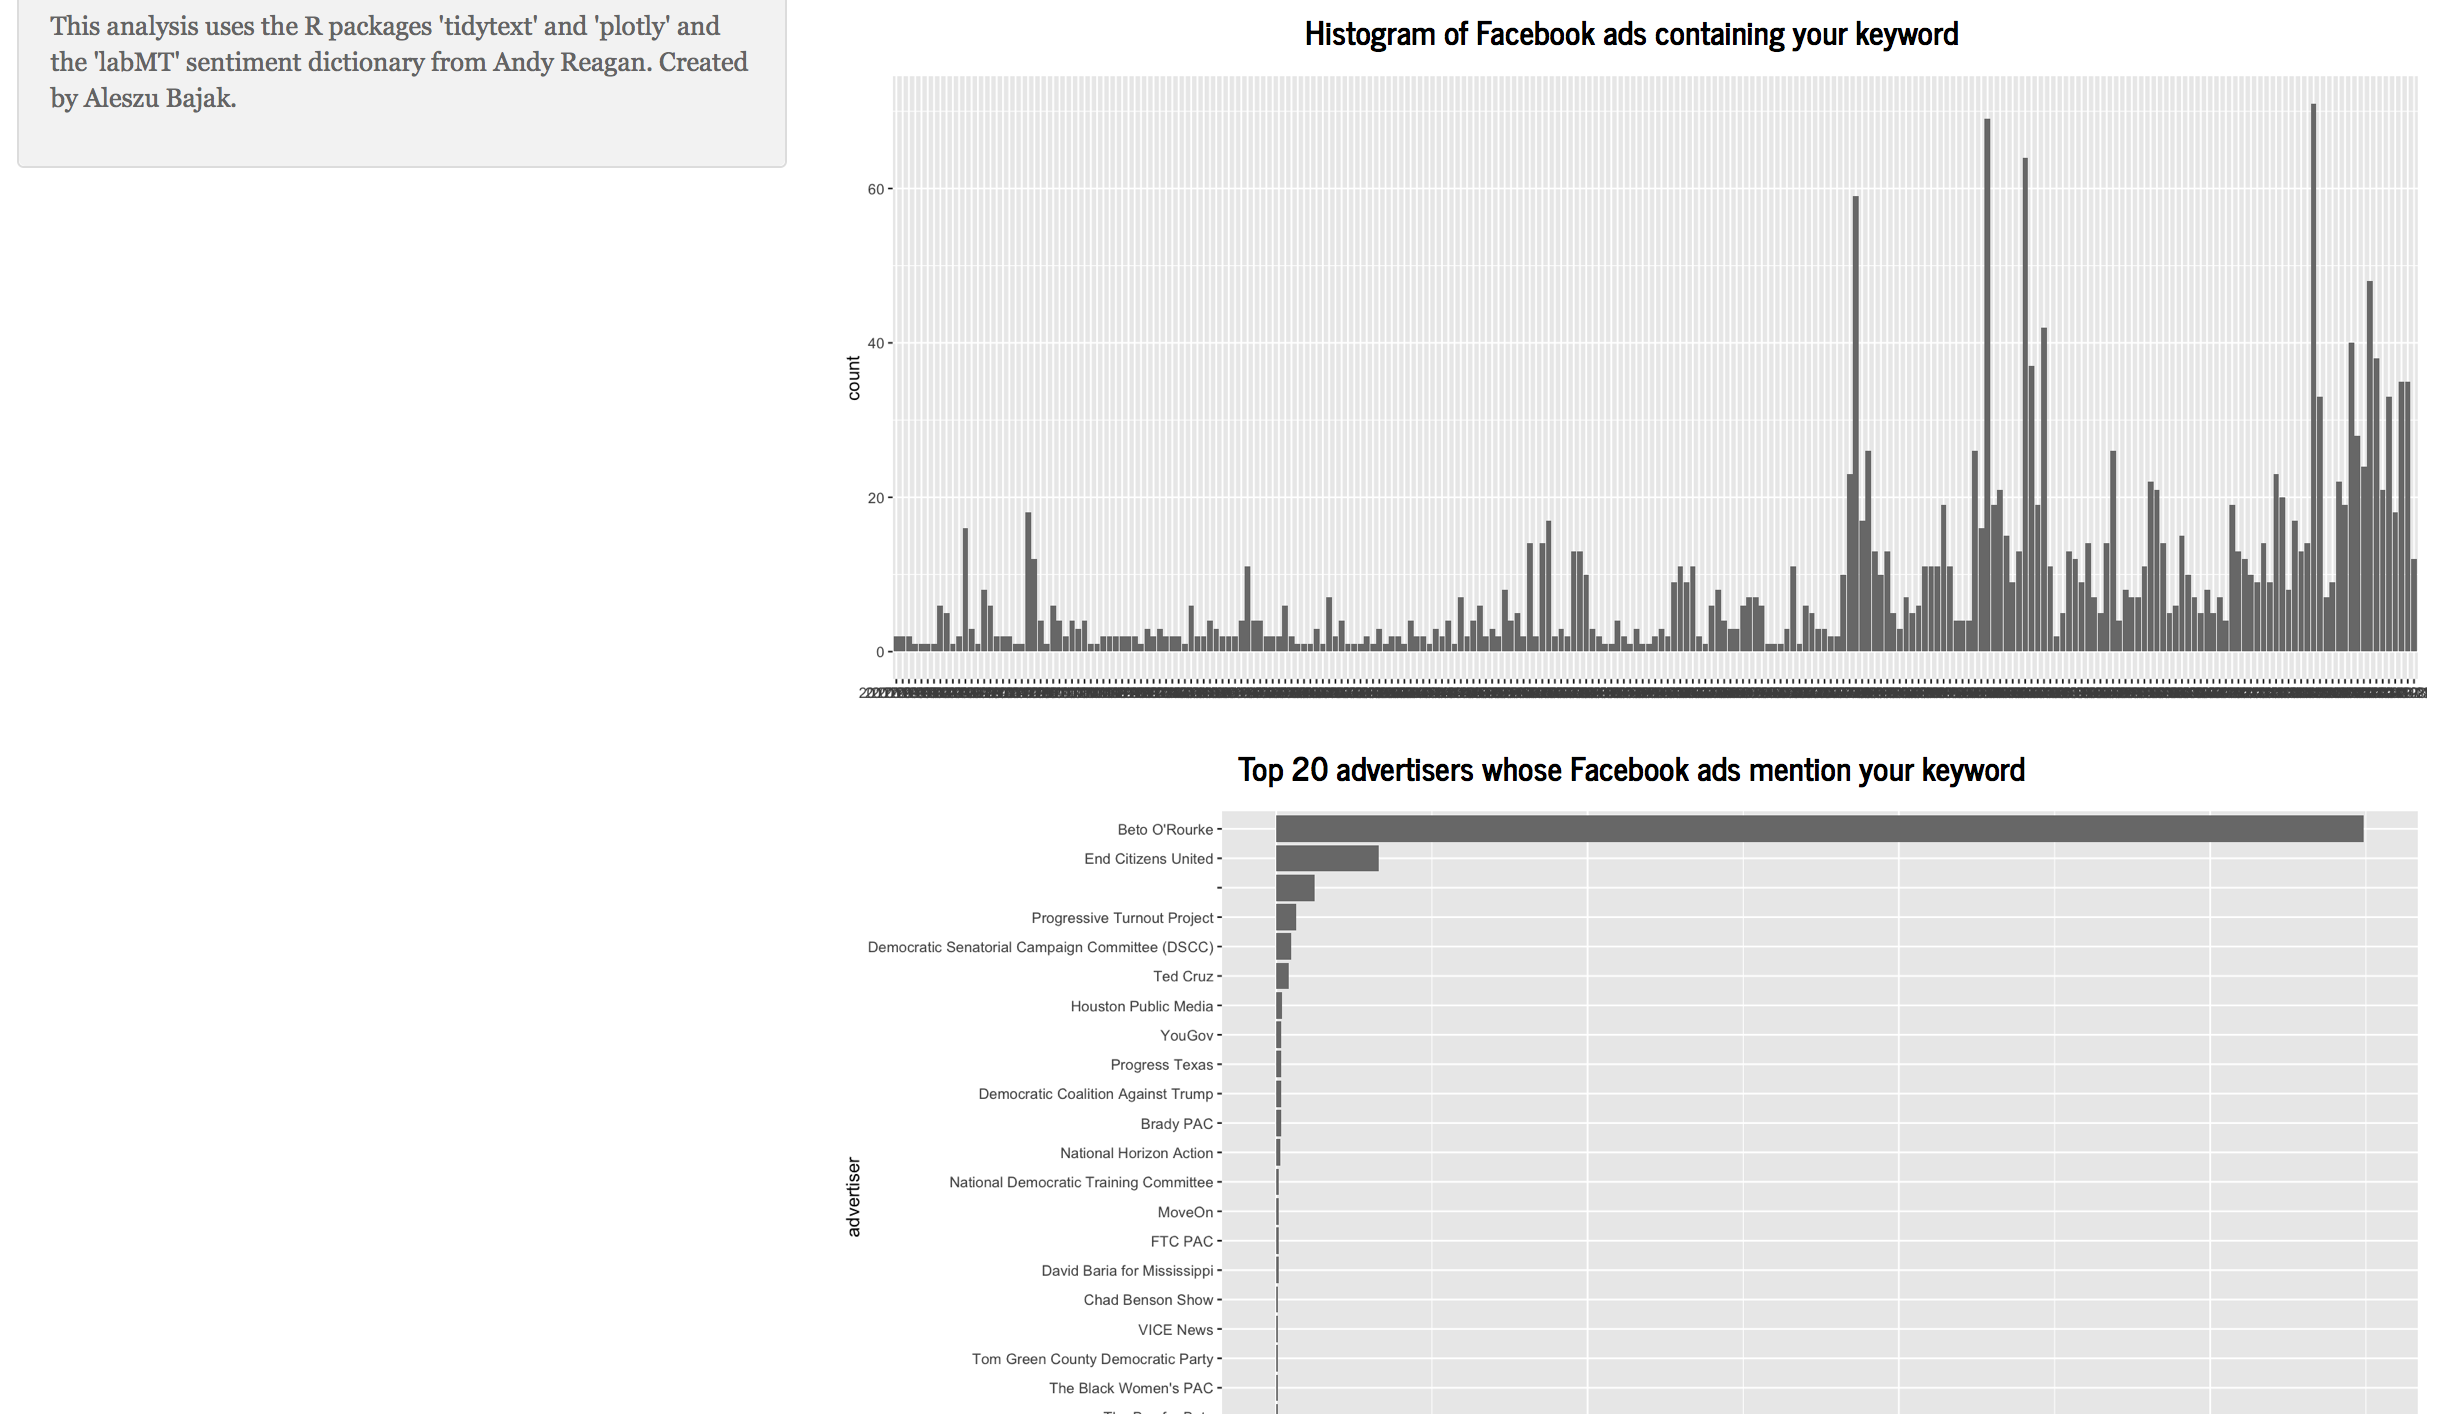
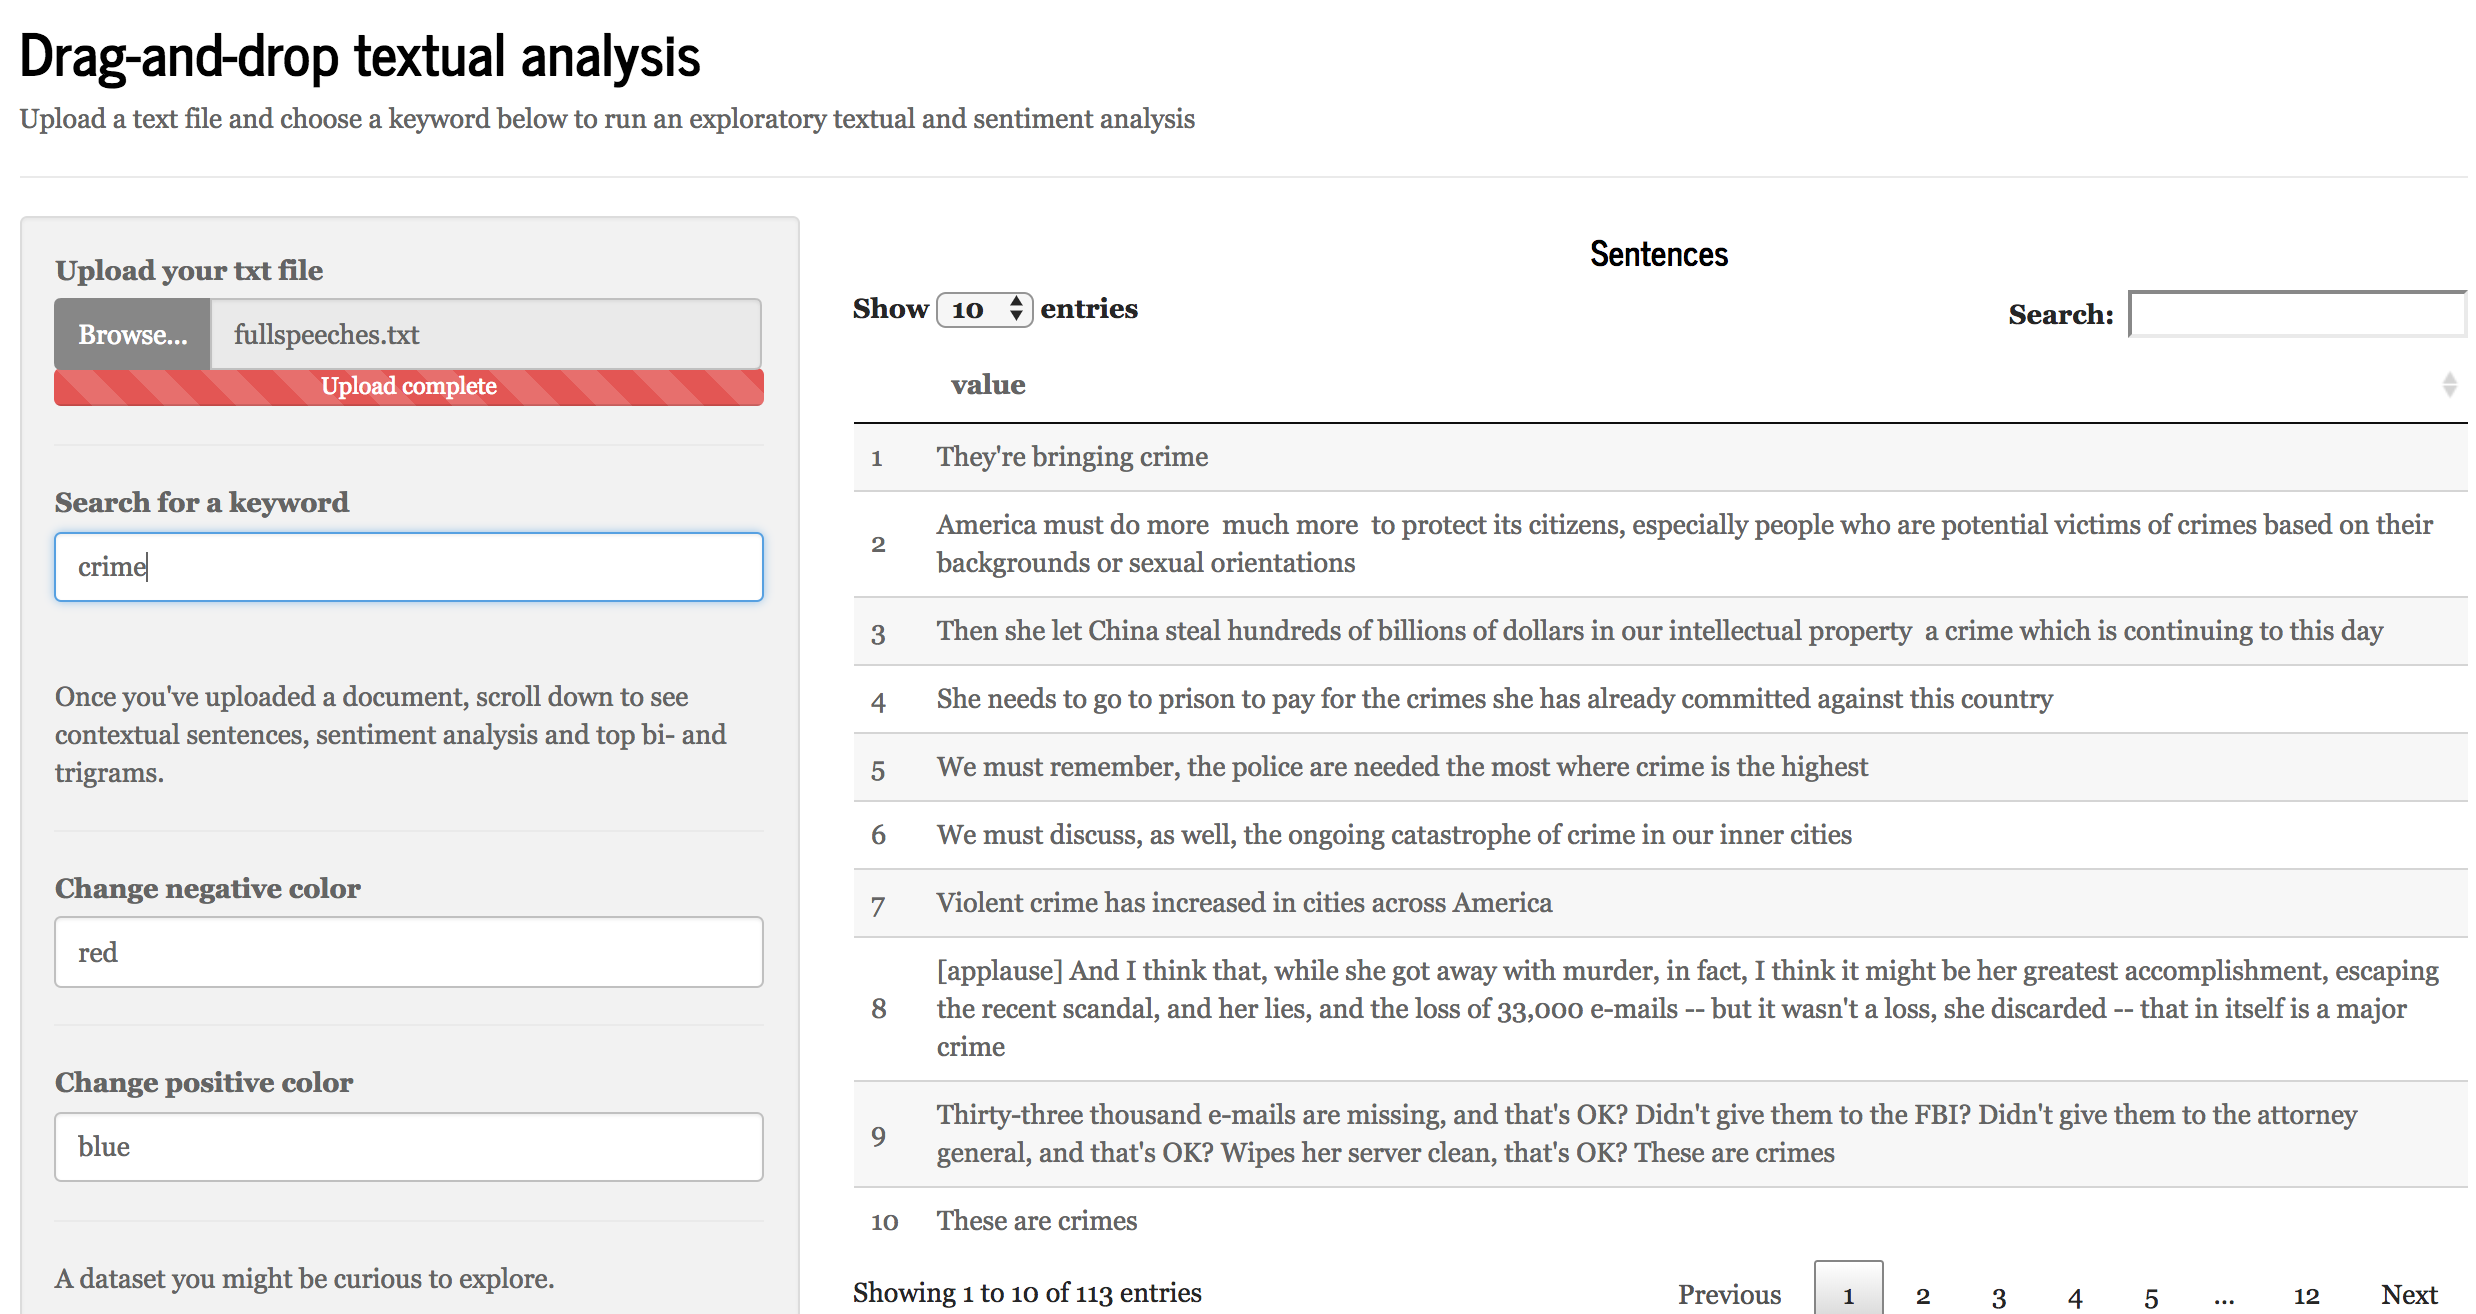
We consider the possibilities enabled by our applications by looking at two use cases. Our first use case with a prototype Shiny app involves looking at a corpus of texts or headlines such as the public speeches of a politician or coverage of a news topic to understand rhetorical patterns, popular formulations and sentiment (See Figure 1). Techniques such as descriptive statistics, sentiment analysis and n-gram analysis are employed. Our second use case with a prototype Shiny app involves discerning patterns in political advertisements on Facebook, allowing for unique insights into the strategies employed in political messaging (See Figure 2). Techniques such as textual and sentiment analysis are employed.
These prototypes point to the possibility of a broader ecosystem of similar deadline-friendly apps for newsrooms that could provide them with greater analytical power and higher-level insights.
This paper was presented at the 2019 Computation + Journalism conference at the University of Miami.
References
[1] “The R Project for Statistical Computing” Retrieved from https://cran.r-project.org/
[2] Robinson, D. and Silge, J. 2018. “tidytext: Text Mining using 'dplyr', 'ggplot2', and Other Tidy Tools” Retrieved from https://cran.r-project.org/web/packages/tidytext/index.html
[3] Ropensci. 2018. “Plotly: an interactive graphing library for R” Retrieved from https://github.com/ropensci/plotly
[4] Reagan, A. 2018. “labMTsimple Documentation” Retrieved from https://media.readthedocs.org/pdf/labmt-simple/latest/labmt-simple.pdf
Demo the Shiny apps
Inspect TXT files
Click here for the TXT Shiny app.
Inspect CSV files
Click here for the CSV Shiny app.
Inspect Facebook political ads
Click here for the Facebook ads Shiny app.
Demo datasets for these Shiny apps
Google Sheet of 20,000+ r/politics Reddit posts from 7/21/17 to 10/12/18.
CSV of Trump tweets through Nov. 2016.
CSV of women running in House and Senate races 2018.
CSV of 1 year of Washington Post Politics headlines.
CSV of 1 year of New York Times Politics headlines.
CSV of three months of Heidi Heitkamp articles.
CSV of six months of Lisa Murkowski articles.
TXT of Trump campaign speeches.
TXT of 2018 Obama rally in Illinois.
TXT of Trump State of the Union speech.
ProPublica's database of Facebook political ads. And find the full dataset here.
Bonus apps
Storybench mapmaker
Click here for the mapmaker Shiny app.
