Tidy anomaly detection
anomalize enables a tidy workflow for detecting anomalies in data. The
main functions are time_decompose(), anomalize(), and
time_recompose(). When combined, it’s quite simple to decompose time
series, detect anomalies, and create bands separating the “normal” data
from the anomalous
data.
You can install the development version with devtools or the most
recent CRAN version with install.packages():
# devtools::install_github("business-science/anomalize")
install.packages("anomalize")anomalize has three main functions:
time_decompose(): Separates the time series into seasonal, trend, and remainder componentsanomalize(): Applies anomaly detection methods to the remainder component.time_recompose(): Calculates limits that separate the “normal” data from the anomalies!
Load the tidyverse and anomalize packages.
library(tidyverse)
library(anomalize)
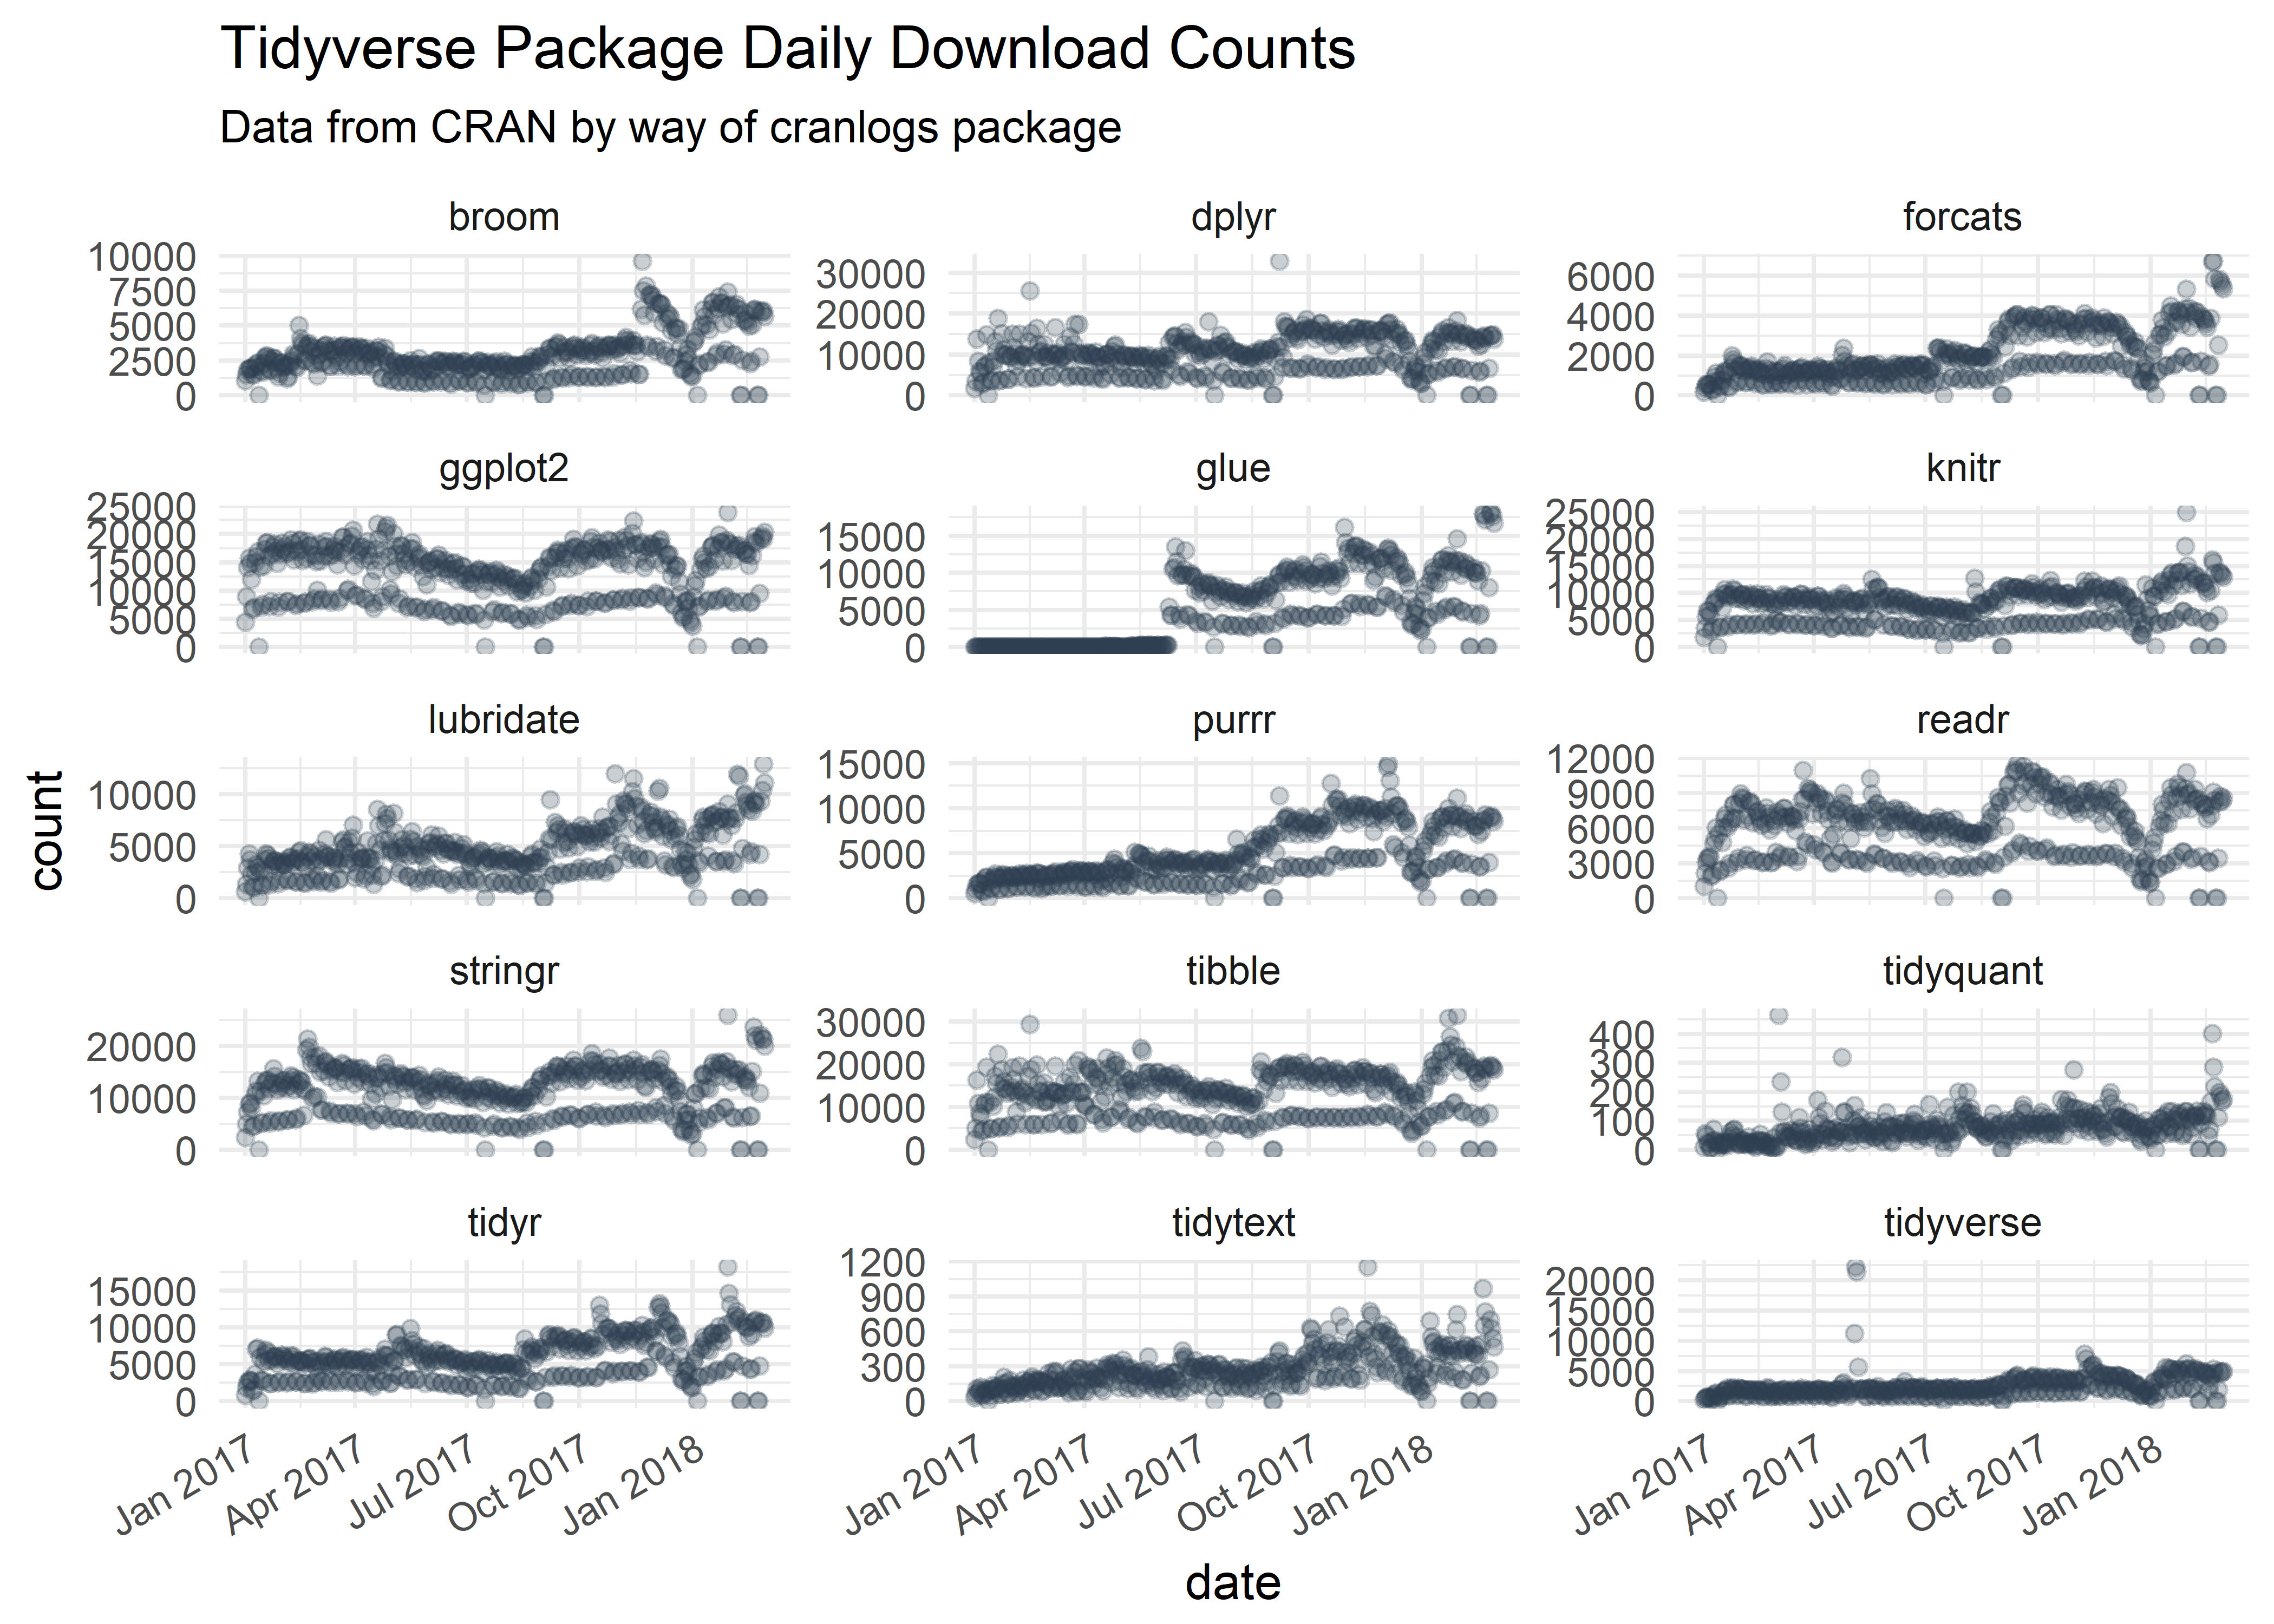
Next, let’s get some data. anomalize ships with a data set called
tidyverse_cran_downloads that contains the daily CRAN download counts
for 15 “tidy” packages from 2017-01-01 to 2018-03-01.
tidyverse_cran_downloads %>%
    ggplot(aes(date, count)) +
    geom_point(color = "#2c3e50", alpha = 0.25) +
    facet_wrap(~ package, scale = "free_y", ncol = 3) +
    theme_minimal() +
    theme(axis.text.x = element_text(angle = 30, hjust = 1)) +
    labs(title = "Tidyverse Package Daily Download Counts",
         subtitle = "Data from CRAN by way of cranlogs package")
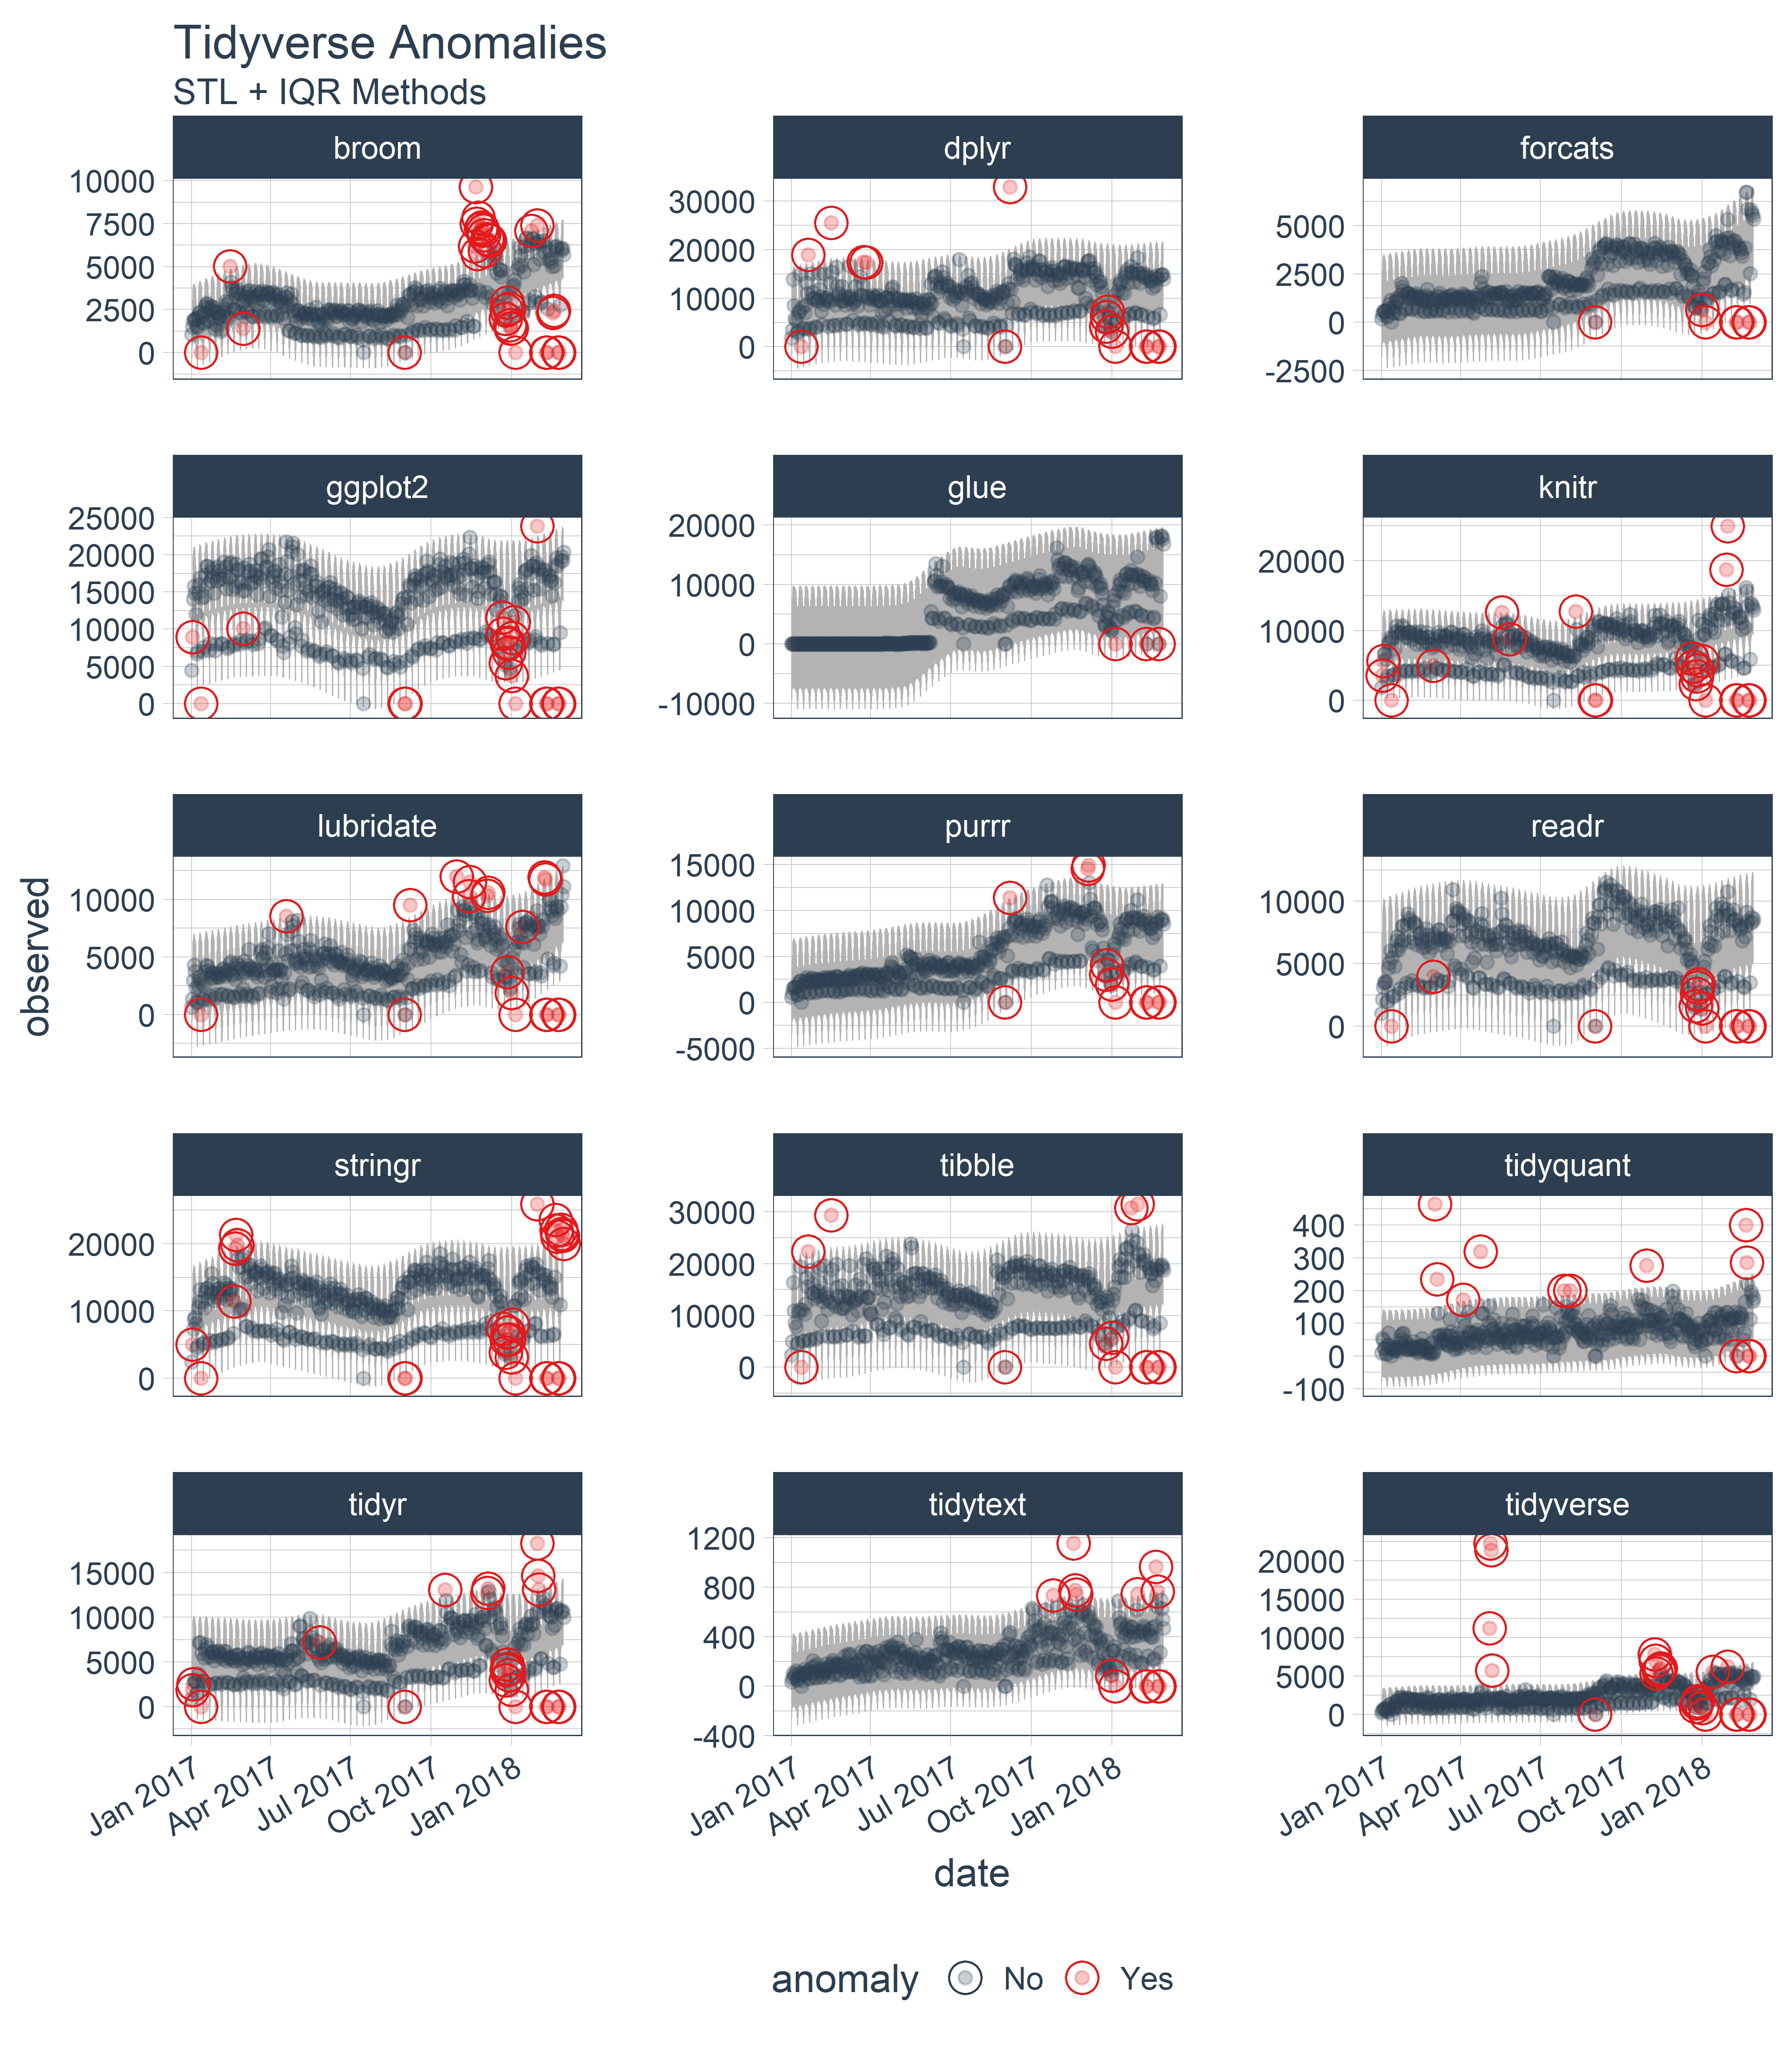
Suppose we want to determine which daily download “counts” are
anomalous. It’s as easy as using the three main functions
(time_decompose(), anomalize(), and time_recompose()) along with a
visualization function, plot_anomalies().
tidyverse_cran_downloads %>%
    # Data Manipulation / Anomaly Detection
    time_decompose(count, method = "stl") %>%
    anomalize(remainder, method = "iqr") %>%
    time_recompose() %>%
    # Anomaly Visualization
    plot_anomalies(time_recomposed = TRUE, ncol = 3, alpha_dots = 0.25) +
    labs(title = "Tidyverse Anomalies", subtitle = "STL + IQR Methods")
If you’re familiar with Twitter’s AnomalyDetection package, you can
implement that method by combining time_decompose(method = "twitter")
with anomalize(method = "gesd"). Additionally, we’ll adjust the trend = "2 months" to adjust the median spans, which is how Twitter’s
decomposition method works.
# Get only lubridate downloads
lubridate_dloads <- tidyverse_cran_downloads %>%
    filter(package == "lubridate") %>%
    ungroup()

# Anomalize!!
lubridate_dloads %>%
    # Twitter + GESD
    time_decompose(count, method = "twitter", trend = "2 months") %>%
    anomalize(remainder, method = "gesd") %>%
    time_recompose() %>%
    # Anomaly Visualziation
    plot_anomalies(time_recomposed = TRUE) +
    labs(title = "Lubridate Anomalies", subtitle = "Twitter + GESD Methods")
Last, we can compare to STL + IQR methods, which use different decomposition and anomaly detection approaches.
lubridate_dloads %>%
    # STL + IQR Anomaly Detection
    time_decompose(count, method = "stl", trend = "2 months") %>%
    anomalize(remainder, method = "iqr") %>%
    time_recompose() %>%
    # Anomaly Visualization
    plot_anomalies(time_recomposed = TRUE) +
labs(title = "Lubridate Anomalies", subtitle = "STL + IQR Methods")There are a several extra capabilities:
time_frequency()andtime_trend()for generating frequency and trend spans using date and datetime information, which is more intuitive than selecting numeric values. Also,period = "auto"automatically selects frequency and trend spans based on the time scale of the data.
# Time Frequency
time_frequency(lubridate_dloads, period = "auto")
#> frequency = 7 days
#> [1] 7
# Time Trend
time_trend(lubridate_dloads, period = "auto")
#> trend = 91 days
#> [1] 91plot_anomaly_decomposition()for visualizing the inner workings of how algorithm detects anomalies in the “remainder”.
tidyverse_cran_downloads %>%
    filter(package == "lubridate") %>%
    ungroup() %>%
    time_decompose(count) %>%
    anomalize(remainder) %>%
    plot_anomaly_decomposition() +
labs(title = "Decomposition of Anomalized Lubridate Downloads")- Vector functions for anomaly detection:
iqr()andgesd(). These are great for just using on numeric data. Note that trend and seasonality should already be removed for time series data.
# Data with outliers
set.seed(100)
x <- rnorm(100)
idx_outliers <- sample(100, size = 5)
x[idx_outliers] <- x[idx_outliers] + 10

# IQR method
iqr(x, alpha = 0.05, max_anoms = 0.2)
#>   [1] "No"  "No"  "No"  "No"  "No"  "No"  "No"  "No"  "No"  "No"  "No"
#>  [12] "No"  "No"  "No"  "No"  "No"  "No"  "No"  "No"  "No"  "No"  "No"
#>  [23] "No"  "No"  "No"  "No"  "No"  "No"  "No"  "No"  "Yes" "No"  "No"
#>  [34] "No"  "No"  "No"  "Yes" "No"  "No"  "No"  "No"  "No"  "No"  "No"
#>  [45] "No"  "No"  "No"  "No"  "No"  "No"  "No"  "No"  "No"  "No"  "No"
#>  [56] "No"  "No"  "No"  "No"  "No"  "No"  "No"  "No"  "No"  "No"  "No"
#>  [67] "No"  "No"  "No"  "No"  "No"  "No"  "No"  "No"  "No"  "No"  "No"
#>  [78] "No"  "No"  "Yes" "No"  "No"  "No"  "No"  "No"  "No"  "No"  "No"
#>  [89] "No"  "Yes" "No"  "No"  "No"  "No"  "Yes" "No"  "No"  "No"  "No"
#> [100] "No"- Anomaly Reports: Using
verbose = TRUE, we can return a nice report of useful information related to the outliers.
lubridate_dloads %>%
    time_decompose(count) %>%
    anomalize(remainder, verbose = TRUE)
#> $anomalized_tbl
#> # A time tibble: 425 x 8
#> # Index: date
#>    date       observed season trend remainder remainder_l1 remainder_l2
#>    <date>        <dbl>  <dbl> <dbl>     <dbl>        <dbl>        <dbl>
#>  1 2017-01-01     643. -2078. 2474.      246.       -3323.        3310.
#>  2 2017-01-02    1350.   518. 2491.    -1659.       -3323.        3310.
#>  3 2017-01-03    2940.  1117. 2508.     -685.       -3323.        3310.
#>  4 2017-01-04    4269.  1220. 2524.      525.       -3323.        3310.
#>  5 2017-01-05    3724.   865. 2541.      318.       -3323.        3310.
#>  6 2017-01-06    2326.   356. 2558.     -588.       -3323.        3310.
#>  7 2017-01-07    1107. -1998. 2574.      531.       -3323.        3310.
#>  8 2017-01-08    1058. -2078. 2591.      545.       -3323.        3310.
#>  9 2017-01-09    2494.   518. 2608.     -632.       -3323.        3310.
#> 10 2017-01-10    3237.  1117. 2624.     -504.       -3323.        3310.
#> # ... with 415 more rows, and 1 more variable: anomaly <chr>
#>
#> $anomaly_details
#> $anomaly_details$outlier
#>   [1] "No"  "No"  "No"  "No"  "No"  "No"  "No"  "No"  "No"  "No"  "No"
#>  [12] "Yes" "No"  "No"  "No"  "No"  "No"  "No"  "No"  "No"  "No"  "No"
#>  [23] "No"  "No"  "No"  "No"  "No"  "No"  "No"  "No"  "No"  "No"  "No"
#>  [34] "No"  "No"  "No"  "No"  "No"  "No"  "No"  "No"  "No"  "No"  "No"
#>  [45] "No"  "No"  "No"  "No"  "No"  "No"  "No"  "No"  "No"  "No"  "No"
#>  [56] "No"  "No"  "No"  "No"  "No"  "No"  "No"  "No"  "No"  "No"  "No"
#>  [67] "No"  "No"  "No"  "No"  "No"  "No"  "No"  "No"  "No"  "No"  "No"
#>  [78] "No"  "No"  "No"  "No"  "No"  "No"  "No"  "No"  "No"  "No"  "No"
#>  [89] "No"  "No"  "No"  "No"  "No"  "No"  "No"  "No"  "No"  "No"  "No"
#> [100] "No"  "No"  "No"  "No"  "No"  "No"  "No"  "No"  "No"  "Yes" "No"
#> [111] "No"  "No"  "No"  "No"  "No"  "No"  "No"  "No"  "No"  "No"  "No"
#> [122] "No"  "No"  "No"  "No"  "No"  "No"  "No"  "No"  "No"  "No"  "No"
#> [133] "No"  "No"  "No"  "No"  "No"  "No"  "No"  "No"  "No"  "No"  "No"
#> [144] "No"  "No"  "No"  "No"  "No"  "No"  "No"  "No"  "No"  "No"  "No"
#> [155] "No"  "No"  "No"  "No"  "No"  "No"  "No"  "No"  "No"  "No"  "No"
#> [166] "No"  "No"  "No"  "No"  "No"  "No"  "No"  "No"  "No"  "No"  "No"
#> [177] "No"  "No"  "No"  "No"  "No"  "No"  "No"  "No"  "No"  "No"  "No"
#> [188] "No"  "No"  "No"  "No"  "No"  "No"  "No"  "No"  "No"  "No"  "No"
#> [199] "No"  "No"  "No"  "No"  "No"  "No"  "No"  "No"  "No"  "No"  "No"
#> [210] "No"  "No"  "No"  "No"  "No"  "No"  "No"  "No"  "No"  "No"  "No"
#> [221] "No"  "No"  "No"  "No"  "No"  "No"  "No"  "No"  "No"  "No"  "No"
#> [232] "No"  "No"  "No"  "No"  "No"  "No"  "No"  "No"  "No"  "No"  "No"
#> [243] "No"  "Yes" "No"  "No"  "No"  "No"  "No"  "Yes" "No"  "No"  "No"
#> [254] "No"  "No"  "No"  "No"  "No"  "No"  "No"  "No"  "No"  "No"  "No"
#> [265] "No"  "No"  "No"  "No"  "No"  "No"  "No"  "No"  "No"  "No"  "No"
#> [276] "No"  "No"  "No"  "No"  "No"  "No"  "No"  "No"  "No"  "No"  "No"
#> [287] "No"  "No"  "No"  "No"  "No"  "No"  "No"  "No"  "No"  "No"  "No"
#> [298] "No"  "No"  "No"  "No"  "No"  "Yes" "No"  "No"  "No"  "No"  "No"
#> [309] "No"  "No"  "No"  "No"  "No"  "No"  "No"  "No"  "Yes" "Yes" "No"
#> [320] "No"  "No"  "No"  "No"  "No"  "No"  "No"  "No"  "No"  "No"  "No"
#> [331] "No"  "No"  "No"  "No"  "No"  "No"  "No"  "Yes" "Yes" "No"  "No"
#> [342] "No"  "No"  "No"  "No"  "No"  "No"  "No"  "No"  "No"  "No"  "No"
#> [353] "No"  "No"  "No"  "No"  "No"  "No"  "No"  "No"  "Yes" "No"  "No"
#> [364] "No"  "No"  "Yes" "No"  "No"  "No"  "Yes" "No"  "No"  "No"  "No"
#> [375] "No"  "No"  "No"  "Yes" "No"  "No"  "No"  "No"  "No"  "No"  "No"
#> [386] "No"  "No"  "No"  "No"  "No"  "No"  "No"  "No"  "No"  "No"  "No"
#> [397] "No"  "No"  "No"  "No"  "No"  "No"  "Yes" "Yes" "Yes" "Yes" "No"
#> [408] "No"  "No"  "No"  "No"  "No"  "No"  "No"  "No"  "No"  "No"  "No"
#> [419] "Yes" "Yes" "No"  "No"  "No"  "No"  "No"
#>
#> $anomaly_details$outlier_idx
#>  [1] 419 405 370 420 303 406 250 366 318 244 338 317  12 378 339 404 403
#> [18] 361 109
#>
#> $anomaly_details$outlier_vals
#>  [1] -8518.886 -7779.522 -6293.275 -6218.430  5557.429 -5477.838  4619.824
#>  [8] -4553.173  4240.767 -4136.721  3804.789  3626.129 -3522.194  3494.339
#> [15]  3486.598  3477.376  3385.065 -3381.355  3347.284
#>
#> $anomaly_details$outlier_direction
#>  [1] "Down" "Down" "Down" "Down" "Up"   "Down" "Up"   "Down" "Up"   "Down"
#> [11] "Up"   "Up"   "Down" "Up"   "Up"   "Up"   "Up"   "Down" "Up"
#>
#> $anomaly_details$critical_limits
#> limit_lower limit_upper
#>   -3323.425    3310.268
#>
#> $anomaly_details$outlier_report
#> # A tibble: 85 x 7
#>     rank index  value limit_lower limit_upper outlier direction
#>    <dbl> <dbl>  <dbl>       <dbl>       <dbl> <chr>   <chr>
#>  1    1.  419. -8519.      -3323.       3310. Yes     Down
#>  2    2.  405. -7780.      -3323.       3310. Yes     Down
#>  3    3.  370. -6293.      -3323.       3310. Yes     Down
#>  4    4.  420. -6218.      -3323.       3310. Yes     Down
#>  5    5.  303.  5557.      -3323.       3310. Yes     Up
#>  6    6.  406. -5478.      -3323.       3310. Yes     Down
#>  7    7.  250.  4620.      -3323.       3310. Yes     Up
#>  8    8.  366. -4553.      -3323.       3310. Yes     Down
#>  9    9.  318.  4241.      -3323.       3310. Yes     Up
#> 10   10.  244. -4137.      -3323.       3310. Yes     Down
#> # ... with 75 more rowsSeveral other packages were instrumental in developing anomaly detection
methods used in anomalize:
- Twitter’s
AnomalyDetection, which implements decomposition using median spans and the Generalized Extreme Studentized Deviation (GESD) test for anomalies. forecast::tsoutliers()function, which implements the IQR method.


