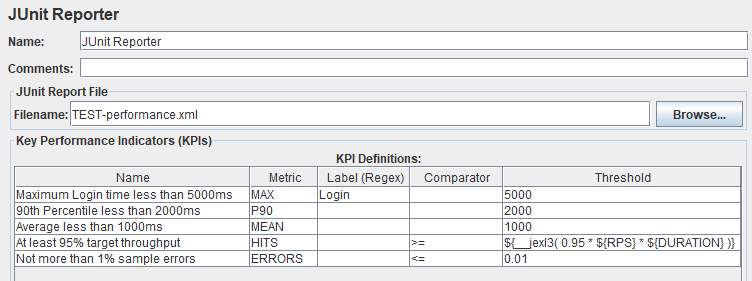
Apache JMeter plugin for generating JUnit Reports in XML format, based on custom KPIs (Key Performance Indicators).
Each KPI will be reported as a test case with a status of success, failure, skipped or error.
KPIs can be defined as thresholds for response time aggregates such as average, median or a percentile.
The output format is compatible with Jenkins, as described here.
<?xml version="1.0" encoding="UTF-8"?>
<testsuite errors="0" failures="0" name="JUnit Reporter" skipped="0" tests="5">
<testcase classname="Maximum Login time less than 5000ms"
name="MAX(Login) < 5000">
<failure message="">Actual value 6230.000000 exceeds threshold 5000.000000 for samples matching "Login"</failure>
</testcase>
<testcase classname="90th Percentile less than 2000ms" name="P90(.*) < 2000"/>
<testcase classname="Average less than 1000ms" name="MEAN(.*) < 1000"/>
<testcase classname="At least 95% target throughput" name="HITS(.*) >= 9500"/>
<testcase classname="Not more than 1% sample errors" name="ERRORS(.*) <= 0.01"/>
</testsuite>JMeter offers several kinds of results output including summary statistics and calls to backend databases/services. None of them can be directly interpreted by CI/CD pipelines to determine the pass or fail outcome of a performance test.
Instead, further processing with third-party tools is required. Examples are:
Those tools have additional installation requirements and may have to process possibly large *.jtl files.
This plugin instead processes each sample as it occurs, with little memory or storage requirements. Aggregates are calculated based on Apache Commons Math3 statistics with "storageless" implementations when sample sets are large.
- Filename: Name of the JUnit report file (with optional path, absolute or relative to current directory). An existing file with the same name will be overwritten without warning.
Each row defines an aggregate metric to calculate for a set of samplers/transactions (matching the Label column) and to compare against a threshold.
-
Name: For identification in the report file (will appear in the
classnameattribute). -
Metric: Defines the aggregate to be calculated of all samples. Supported values:
Metric Meaning MEAN, AVERAGE, μ Average response time (arithmetic mean) SD, σ Standard Deviation of response times (population/non-bias corrected) Pn n-th percentile response time (e.g. P90). One of two different algorithms is used for percentile calcuations: A more accurate one for smaller sample sets and an estimate for larger sample sets. MAX Maximum response time MIN Minimum response time HITS, SAMPLES Total number of samples (requests) ERRORS Error rate, fraction of unsuccessful samples (between 0 and 1) Other, custom metrics can be defined by implementing the interface
Metricand specifying the fully-qualified class name in the Metric column.If the Metric is empty or invalid the KPI will be skipped.
-
Label (Regex): Regular expression defining what samples to include in calculation. An empty Label column matches all samples (equivalent to
.*). The sample name must fully match the expression to be included. -
Comparator: What operation to use for comparing the (actual) measured value with the (expected) threshold. Supported values:
<(default),<=,>,>=. -
Threshold: Upper or lower bound that the value must not exceed. Decimal number. Unit is milliseconds for response time metrics. KPI will be skipped if threshold is undefined or invalid.
| Name | Metric | Label (Regex) | Comparator | Threshold |
|---|---|---|---|---|
| #1 | P50 | Web_.* | <= | 1000 |
| #2 | P50 | App_.* | <= | 2000 |
| #3 | HITS | .* | >= | ${__jexl3( 0.95 * ${RPS} * ${DURATION} )} |
The first two KPIs are for the median (50th percentile) response time, for sample names beginning with "Web_" and "App_" with different thresholds (1000 and 2000 milliseconds, respectively).
The third KPI asserts a minimum of 95% overall throughput by defining a threshold for the total number of samples to compare with 95% of the product of requests per seconds and test duration (in seconds).
The following properties control the plugin behaviour:
jmeter.junit.valuesStoreLimit: How many sample values are stored in memory for calculating percentiles. When this limit is exceeded, an estimate based on the P-Square Algorithm is used instead. Default: 256K values (8 bytedouble) to fit in 2 MB (huge page size). This limit applies for each Percentile KPI, as opposed to an overall limit.
Via PluginsManager
Under tab "Available Plugins", select "JUnit Reporter", then click "Apply Changes and Restart JMeter".
Via Package from JMeter-Plugins.org
Extract the zip package into JMeter's lib directory, then restart JMeter.
- Copy the jmeter-junit-reporter jar file into JMeter's lib/ext directory.
- Restart JMeter.
- Minimum JMeter version 5.0
- Calculations are double precision
- Only Sample response times are processed, other measurements such as connect time or latency are not supported
