Serverless computing has seen rapid adoption because of its instant scalability, flexible billing model, and economies of scale. In serverless, developers structure their applications as a collection of functions invoked by various events like clicks, and cloud providers take responsibility for cloud infrastructure management. As with other cloud services, serverless deployments require responsiveness and performance predictability manifested through low average and tail latencies. While the average end-to-end latency has been extensively studied in prior works, existing papers lack a detailed characterization of the effects of tail latency in real-world serverless scenarios and their root causes.
In response, we introduce STeLLAR, an open-source serverless benchmarking framework, which enables an accurate performance characterization of serverless deployments. STeLLAR is provider-agnostic and highly configurable, allowing the analysis of both end-to-end and per-component performance with minimal instrumentation effort. Using STeLLAR, we study three leading serverless clouds and reveal that storage accesses and bursty function invocation traffic are key factors impacting tail latency in modern serverless systems. Finally, we identify important factors that do not contribute to latency variability, such as the choice of language runtime.
If you decide to use STeLLAR for your research and experiments, we are thrilled to support you by offering advice for potential extensions of vHive and always open for collaboration.
Please cite our paper that has recently been accepted to IISWC 2021:
@inproceedings{ustiugov:analyzing,
  author    = {Dmitrii Ustiugov and
               Theodor Amariucai and
               Boris Grot},
  title     = {Analyzing Tail Latency in Serverless Clouds with STeLLAR},
  booktitle = {Proceedings of the 2021 IEEE International Symposium on Workload Characterization (IISWC)},
  publisher = {{IEEE}},
  year      = {2021},
  doi       = {},
}
STeLLAR can be readily deployed on premises or in the cloud. We provide a quick-start guide that describes the intial setup, as well as how to set up benchmarking experiments. More details of the STeLLAR design can be found in our IISWC'21 paper).
We would be happy to answer any questions in GitHub Issues and encourage the open-source community to submit new Issues, assist in addressing existing issues and limitations, and contribute their code with Pull Requests.
STeLLAR is free. We publish the code under the terms of the MIT License that allows distribution, modification, and commercial use. This software, however, comes without any warranty or liability.
The software is maintained at the EASE lab as part of the University of Edinburgh.
- Dmitrii Ustiugov: GitHub, twitter, web page
- Theodor Amariucai
To begin with, we provide an overview of our benchmarking solution and define the main terms used throughout the rest of the codebase:
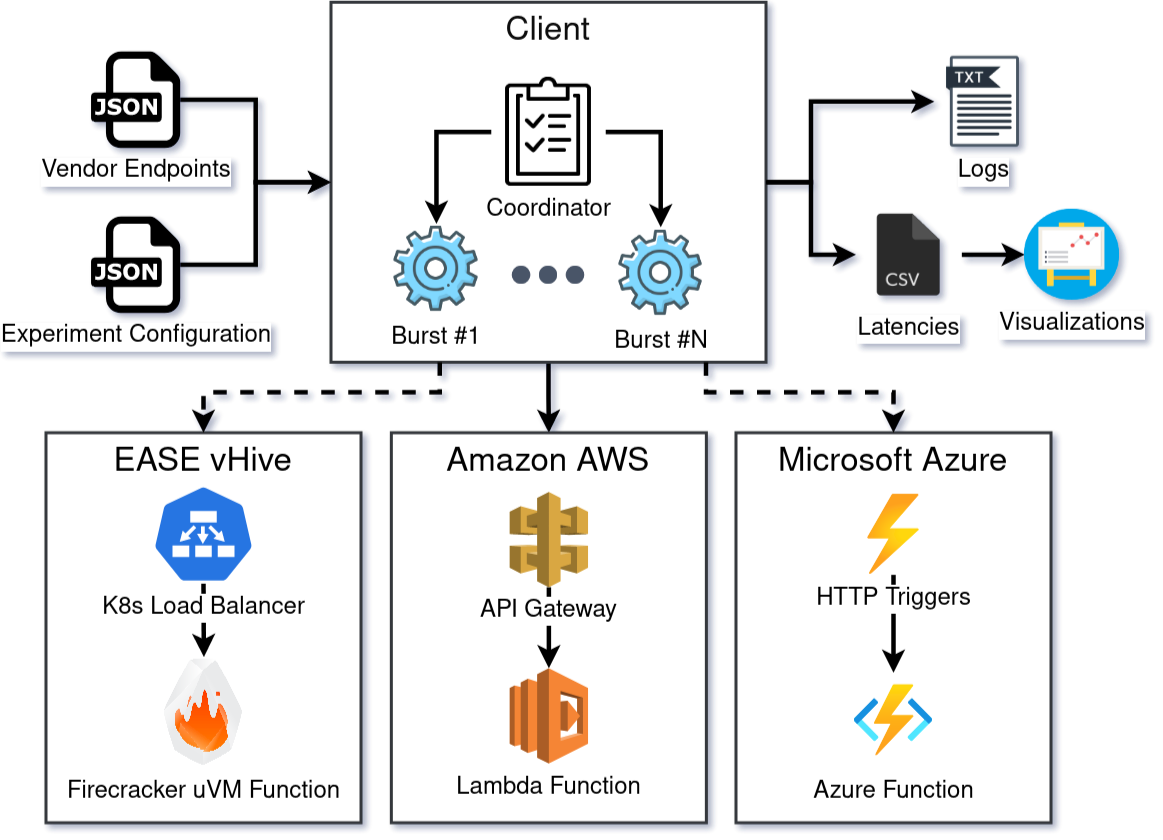
- The coordinator orchestrates the entire benchmarking procedure.
- The experiment configuration is an input JSON file used to specify and customize the experiments.
- An endpoint is a URL used for locating the function instance over the Internet. As seen in the diagram, this URL most often points to resources such as AWS API Gateway, Azure HTTP Triggers, vHive Kubernetes Load Balancer, or similar.
- The vendor endpoints input JSON file is only used for providers such as vHive that do not currently support automated function management (e.g., function listing, deployment, repurposing, or removal via SDKs or APIs).
- The inter-arrival time (IAT) is the time interval that the client waits for in-between sending two bursts to the same endpoint. To add some variability and simulate a more realistic scenario, we sample this from a shifted exponential distribution. For example, if we set the IAT to 10 minutes (modeling cold starts for most vendors), generated values can be, e.g., 10m12s, 10m27s, 11m.
- Multiple endpoints can be used simultaneously by the same experiment to speed up the benchmarking. The JSON configuration field parallelism defines this number: the higher it is, the more endpoints will be allocated, and the more bursts will be sent in short succession (speeding up the process for large IATs).
- The latencies CSV files are the main output of the evaluation framework. They are used in our custom Python plotting utility suite to produce insightful visualizations.
- The logs text file (Figure 4.2) is the final output of the benchmarking client. Log records are useful for optimizing code and debugging problematic behavior.
Finally, we look at the procedural steps adopted by the framework:
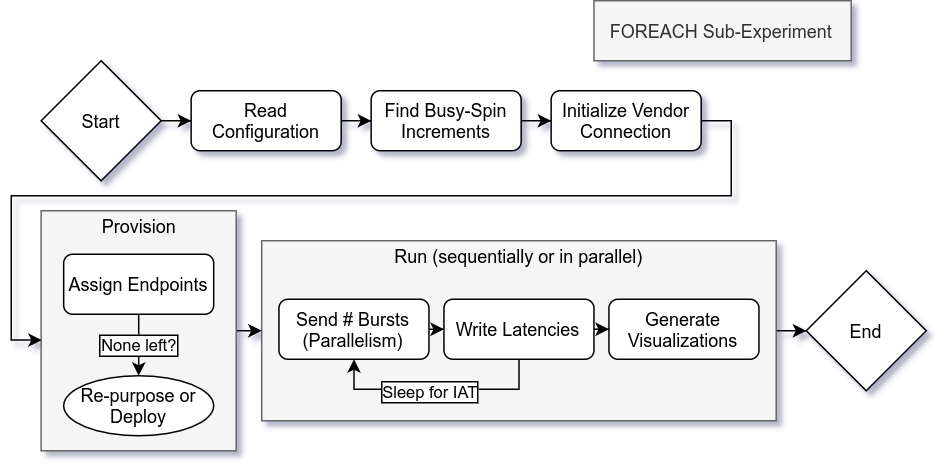
- The JSON configuration file is read and parsed, and any default field values are assigned. If the configuration file is missing, the program throws a fatal error.
- Experiment service times (e.g., 10 seconds) are translated on the client machine into numbers representing busy-spin increment limits (e.g., 10,000,000). In turn, those are used by the measurement function on the server machine to keep the processor busy-spinning.
- A connection with the serverless vendor is established. This is abstracted away behind a common interface having only four functions: ListAPIs, DeployFunction, RemoveFunction, and UpdateFunction. Used exclusively throughout the codebase, this interface offers seamless integration functionality with any provider.
- In the provisioning phase, existing endpoints are first queried either using official provider APIs or from a local file. The corresponding serverless functions are then updated, deployed, or removed to match the specified configuration file.
- The last step runs all the experiments either sequentially or in parallel: bursts are successively sent to each available endpoint, followed by a sleep duration specified by the IAT. The process is repeated until all responses have been recorded to disk. Finally, statistics and visualizations are generated.
We integrate all necessary server-side functionality into a single function that we call a measurement function. This approach is similar to that taken in [40] and other serverless performance evaluation frameworks. A measurement function can perform up to three tasks, depending on the use case:
- It always collects function instance runtime information.
- If applicable, the function will simulate work by incrementing a variable in a busy-spin loop. This can be as simple as “for i := 0; i<incrementLimit; i++{}”.
- If applicable, the function records invocation timing. This is particularly useful for our data transfer studies where we complement client-measured round-trip time with internal function timestamps for validation purposes.
Zippackaging deployments only apply toproducer-consumerimages and will not be supported by any future images.
- Code storage limit
Cannot update function code: CodeStorageExceededException: Code storage limit exceeded.
{
  RespMetadata: {
    StatusCode: 400,
    RequestID: "886339b1-63ae-4f80-a923-7c1ed4201b6e"
  },
  Message_: "Code storage limit exceeded.",
  Type: "User"
}
-
Regional APIs limit
600 -
Rare AWS errors (solved by restarting experiment)
HTTP request failed with error dial tcp: lookup msi6v4vdwk.execute-api.us-west-1.amazonaws.com on 128.110.156.4:53: no such host
HTTP request failed with error dial tcp: lookup 10m09hsby0.execute-api.us-west-1.amazonaws.com on 128.110.156.4:53: server misbehaving


