Analyze the data for an independent gaming company's most recent fantasy game Heroes of Pymoli. Like many others in its genre, the game is free-to-play, but players are encouraged to purchase optional items that enhance their playing experience. As a first task, the company would like you to generate a report that breaks down the game's purchasing data into meaningful insights.
- Pandas
- Jupyter Notebook
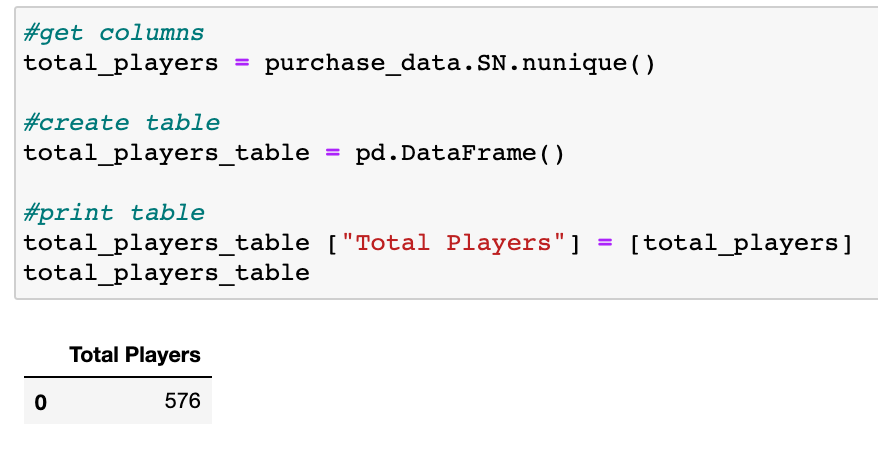
Player Count
- Total Number of Players

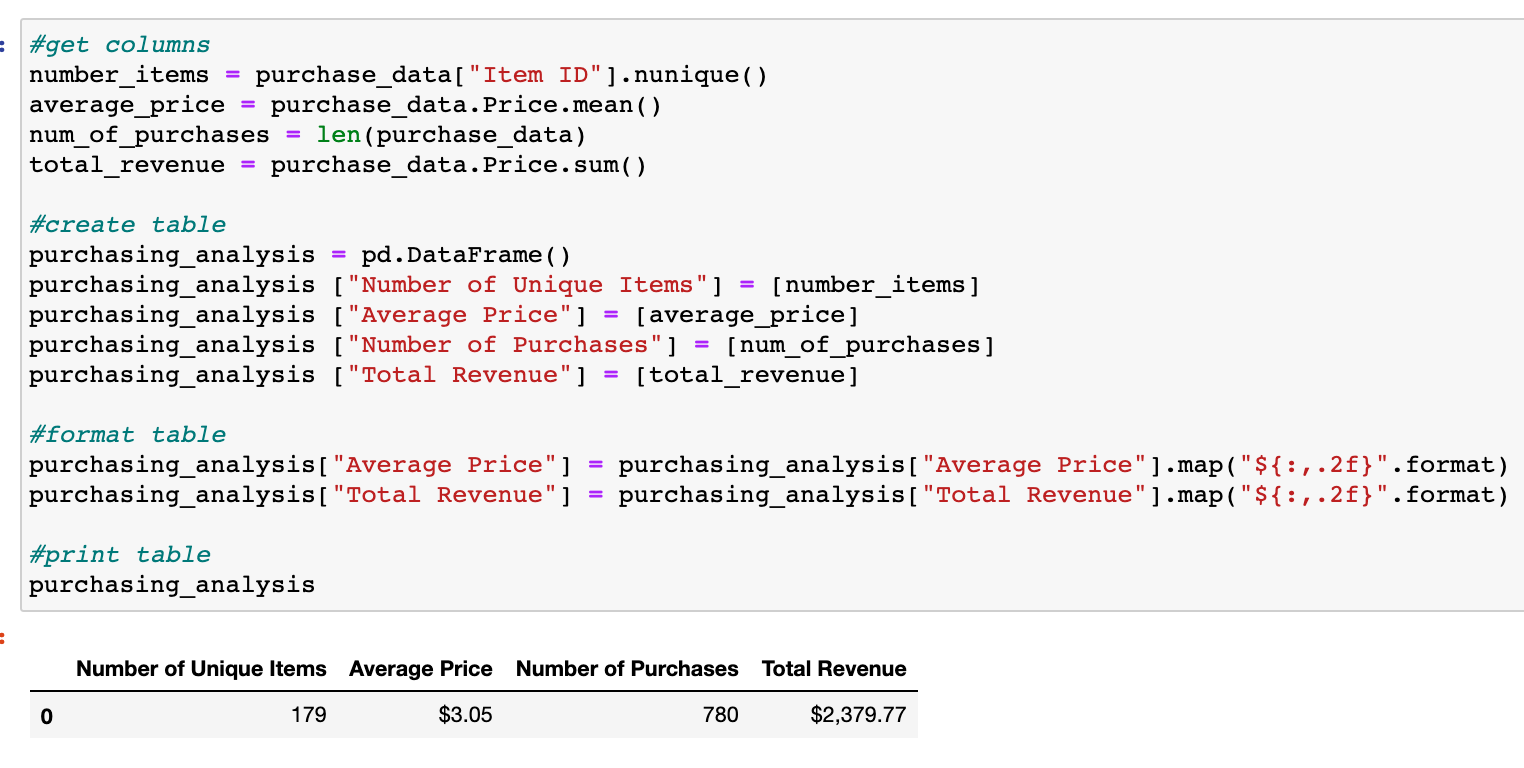
Purchasing Analysis (Total)
- Number of Unique Items
- Average Purchase Price
- Total Number of Purchases
- Total Revenue

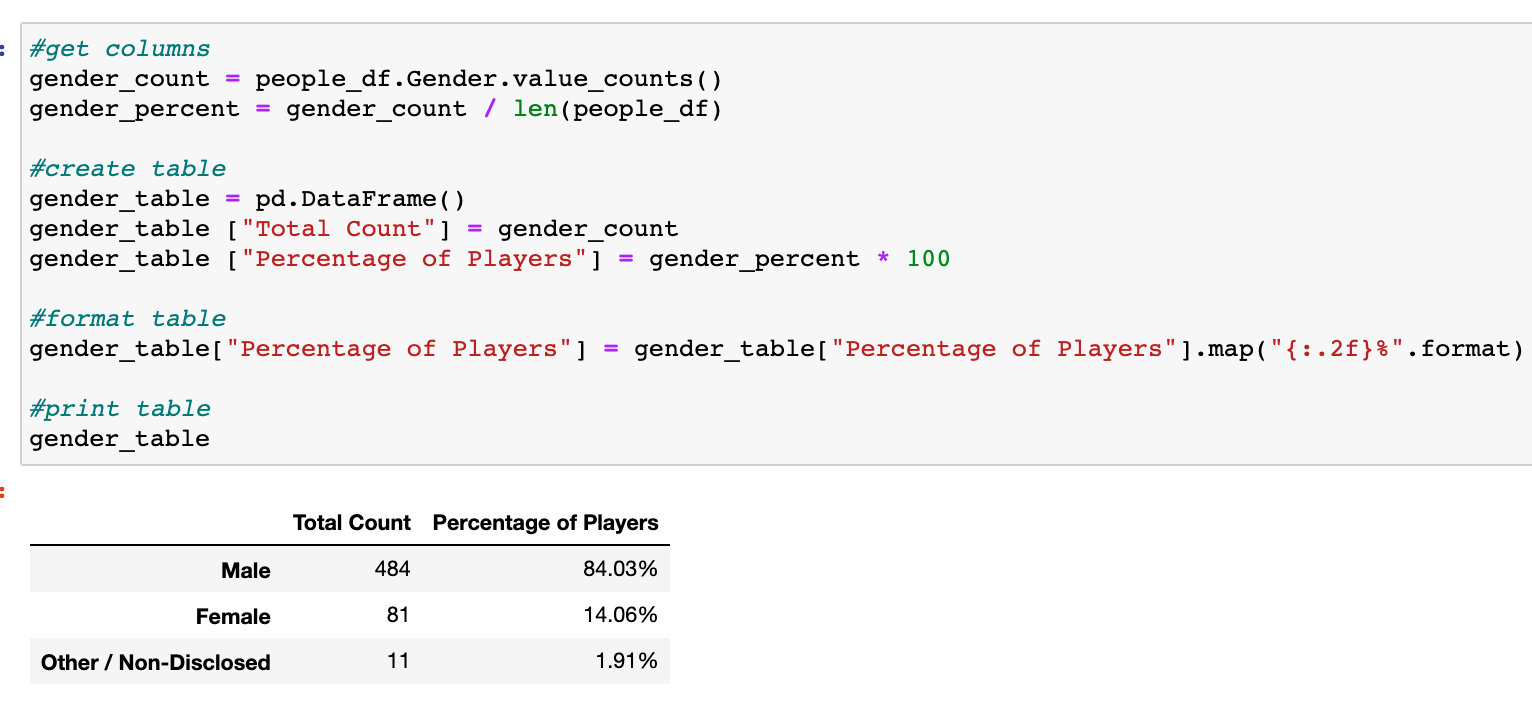
Gender Demographics
- Percentage and Count of Male Players
- Percentage and Count of Female Players
- Percentage and Count of Other / Non-Disclosed

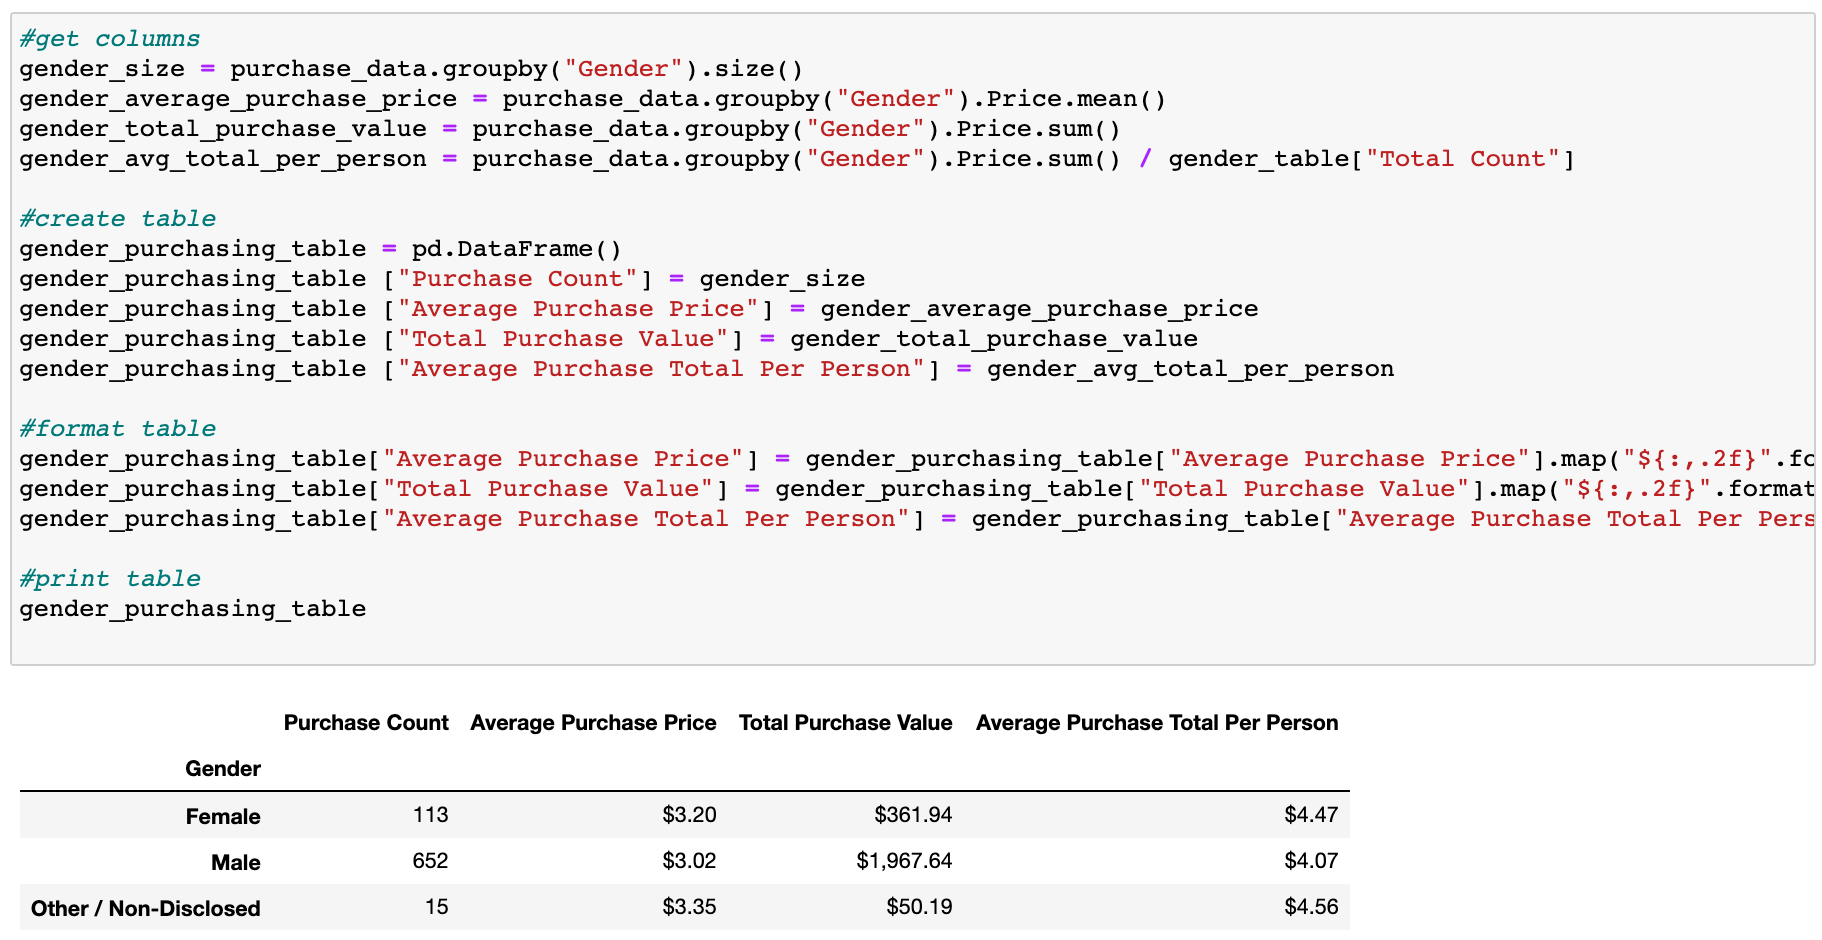
Purchasing Analysis (Gender)
The below each broken by gender:
- Purchase Count
- Average Purchase Price
- Total Purchase Value
- Average Purchase Total per Person by Gender

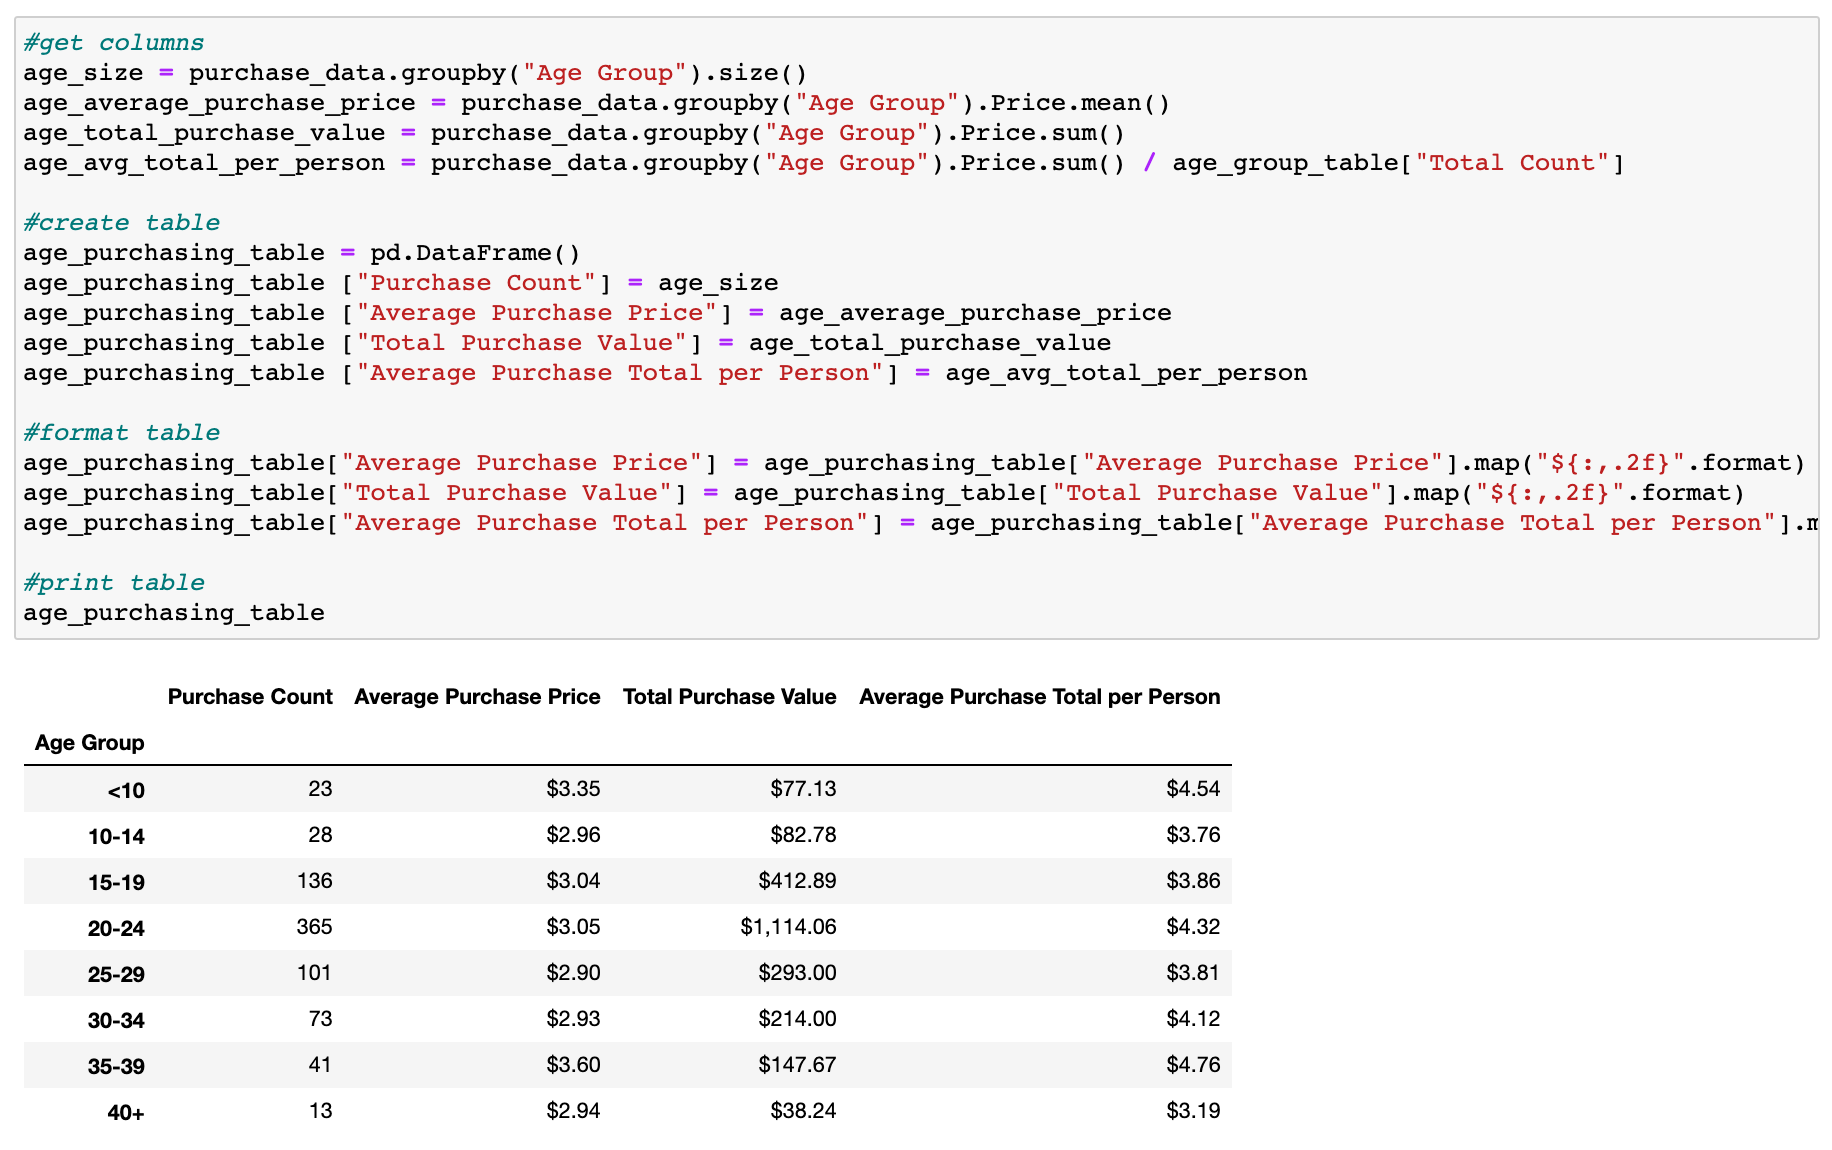
Age Demographics
The below each broken into bins of 4 years (i.e. <10, 10-14, 15-19, etc.)
- Purchase Count
- Average Purchase Price
- Total Purchase Value
- Average Purchase Total per Person by Age Group

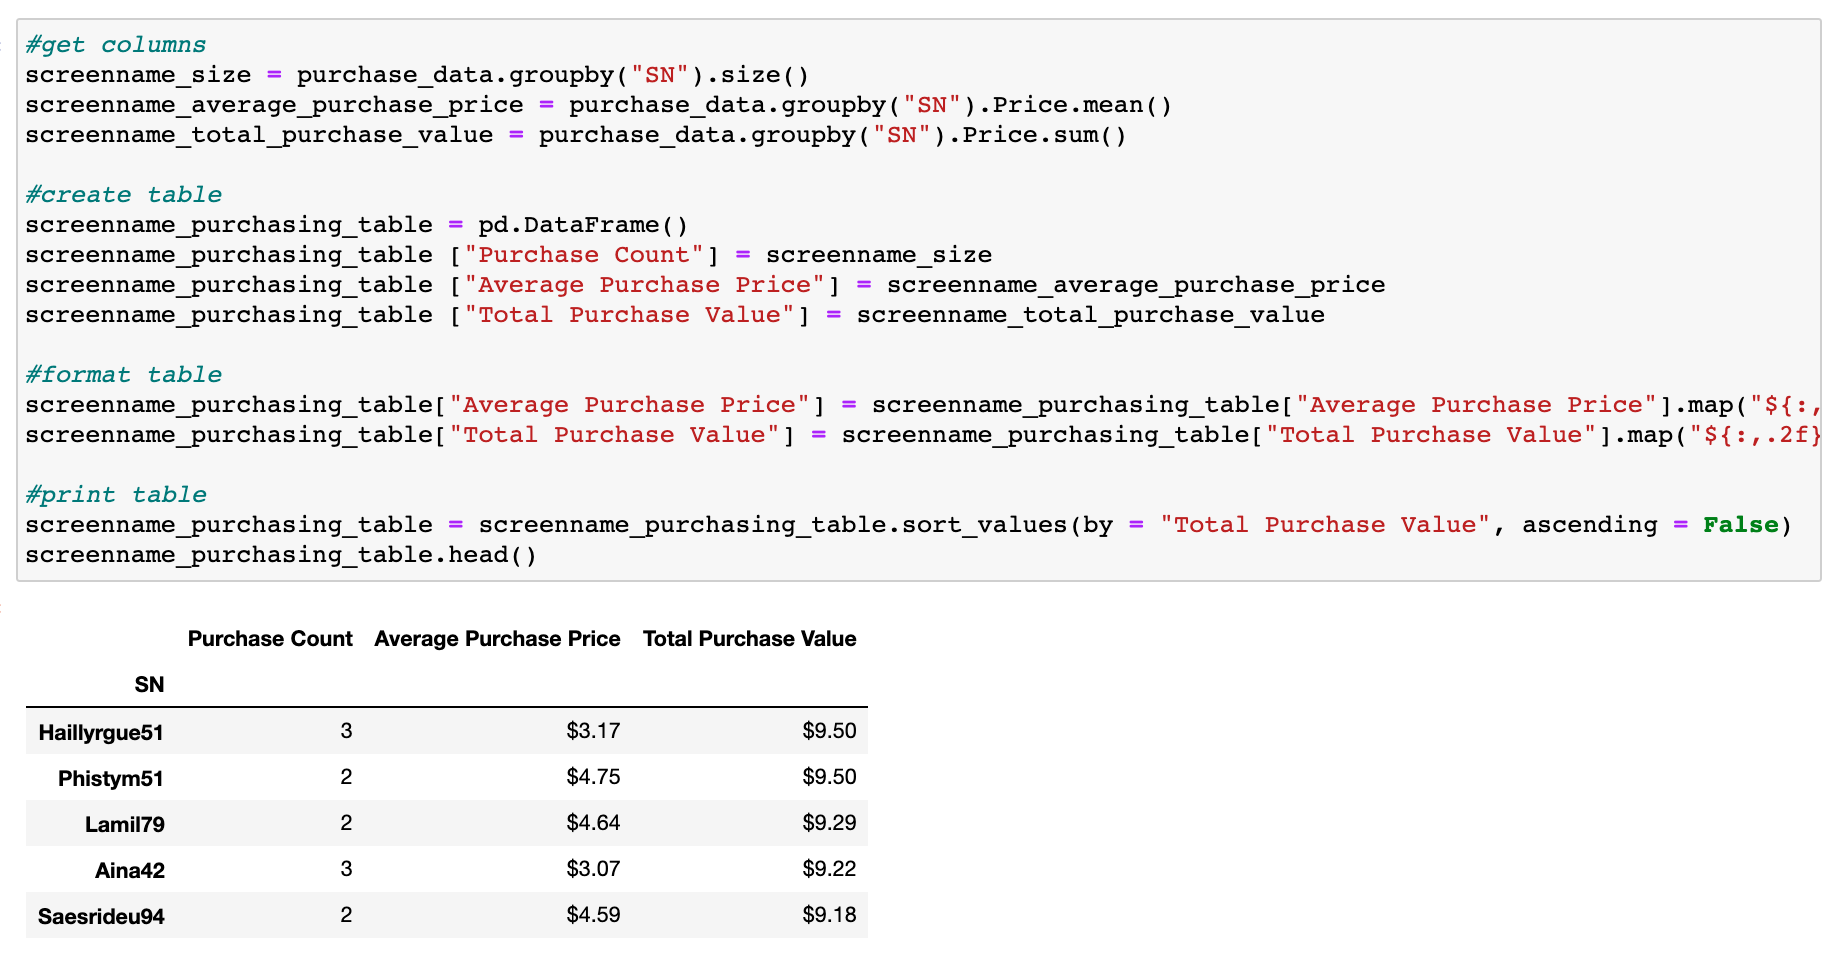
Top Spenders Identify the the top 5 spenders in the game by total purchase value, then list (in a table):
- SN
- Purchase Count
- Average Purchase Price
- Total Purchase Value

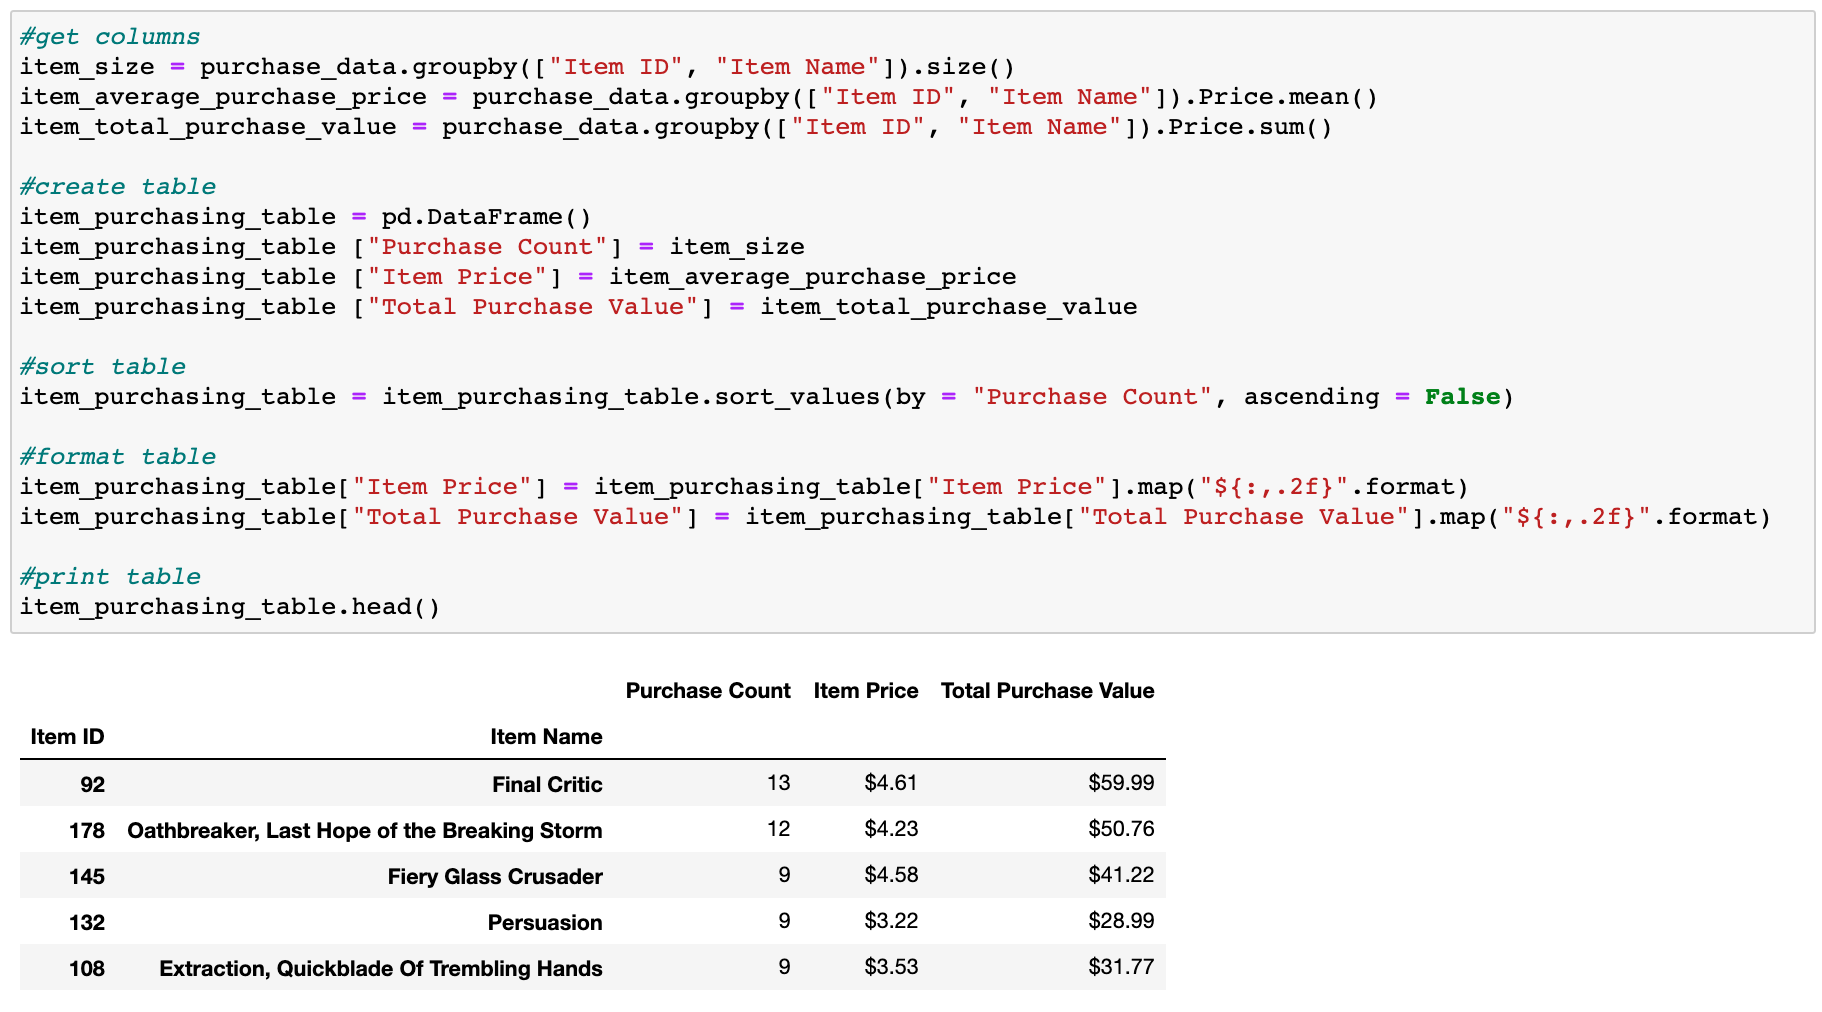
Most Popular Items
Identify the 5 most popular items by purchase count, then list (in a table):
- Item ID
- Item Name
- Purchase Count
- Item Price
- Total Purchase Value

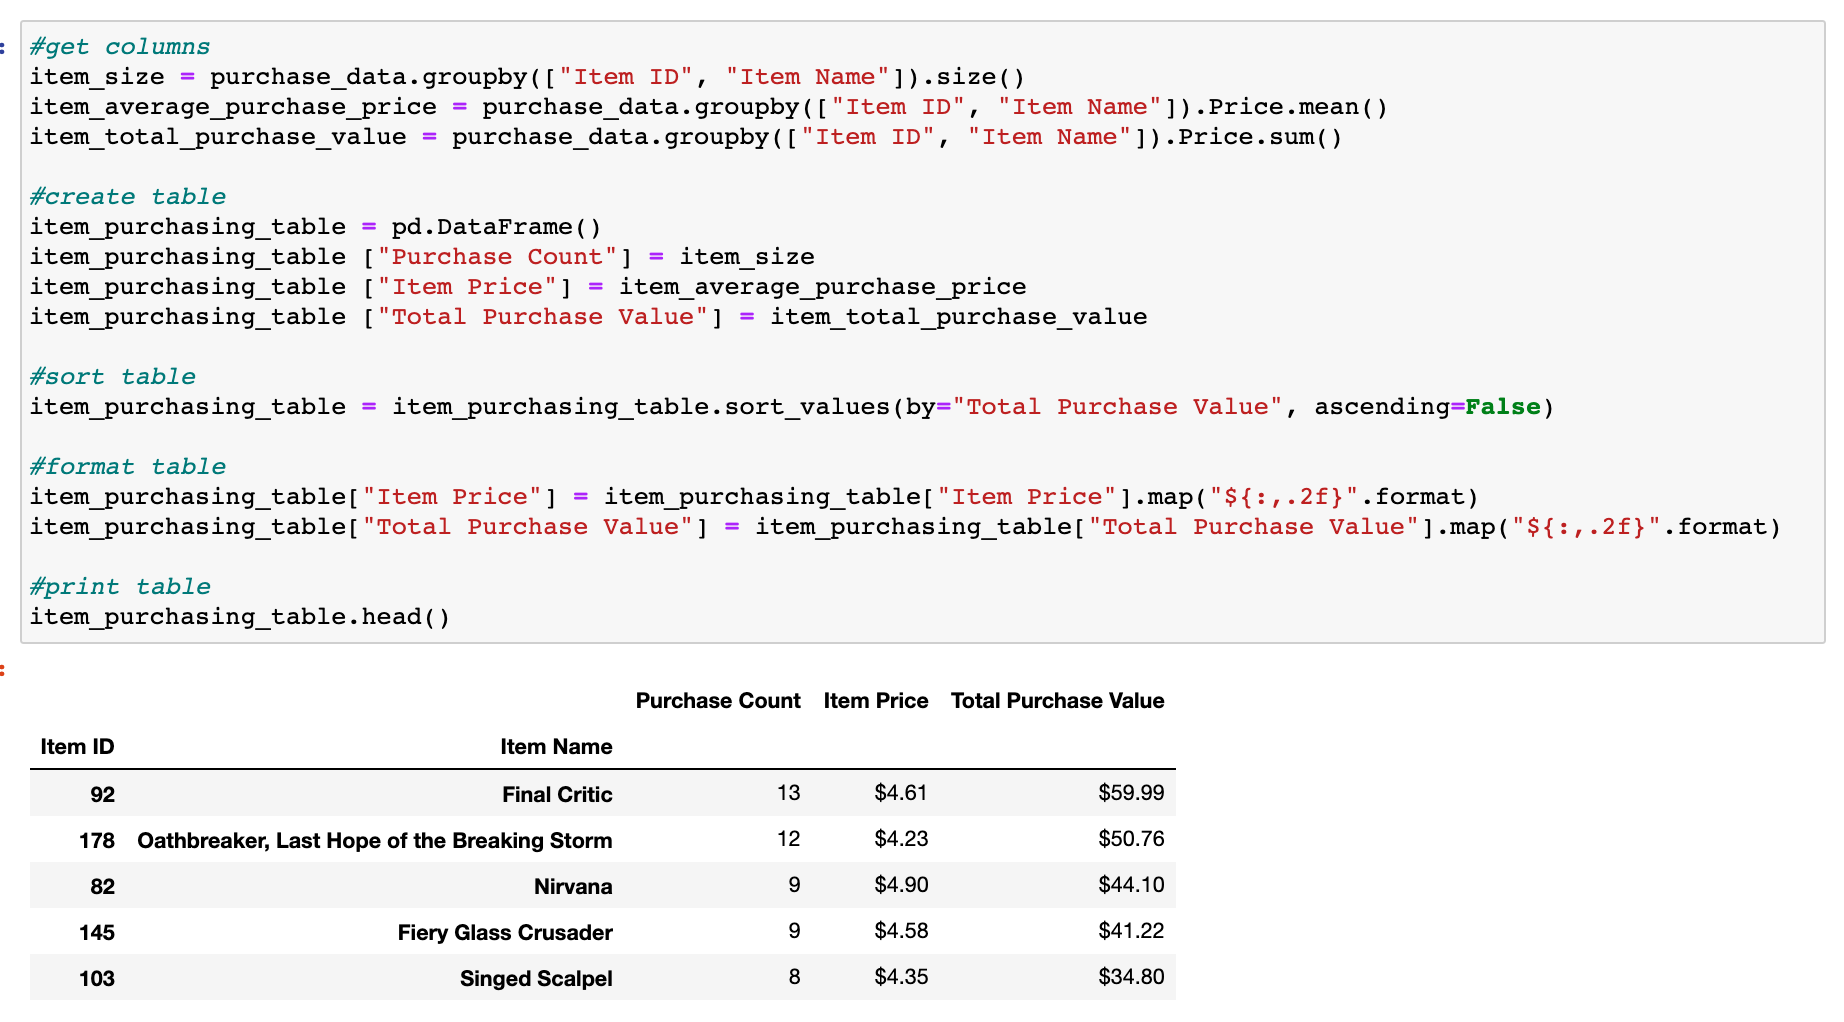
Most Profitable Items
Identify the 5 most profitable items by total purchase value, then list (in a table):
- Item ID
- Item Name
- Purchase Count
- Item Price
- Total Purchase Value

Alex Arnold: alexnarnold630@gmail.com