You've decided to treat yourself to a long holiday vacation in Honolulu, Hawaii! To help with your trip planning, you need to do some climate analysis on the area. The following outlines what you need to do.
- SQLAlchemy
- ORM Queries
- Pandas
- Matplotlib
- Jupyter Notebook
Use Python and SQLAlchemy to do basic climate analysis and data exploration of your climate database. All of the following analysis should be completed using SQLAlchemy ORM queries, Pandas, and Matplotlib.
- Design a query to retrieve the last 12 months of precipitation data.
- Select only the
dateandprcpvalues. - Load the query results into a Pandas DataFrame and set the index to the date column.
- Sort the DataFrame values by
date. - Plot the results using the DataFrame
plotmethod. - Use Pandas to print the summary statistics for the precipitation data.

-
Design a query to calculate the total number of stations.
-
Design a query to find the most active stations.
- List the stations and observation counts in descending order.
- Which station has the highest number of observations?
-
Design a query to retrieve the last 12 months of temperature observation data (TOBS).
- Filter by the station with the highest number of observations.
- Plot the results as a histogram.

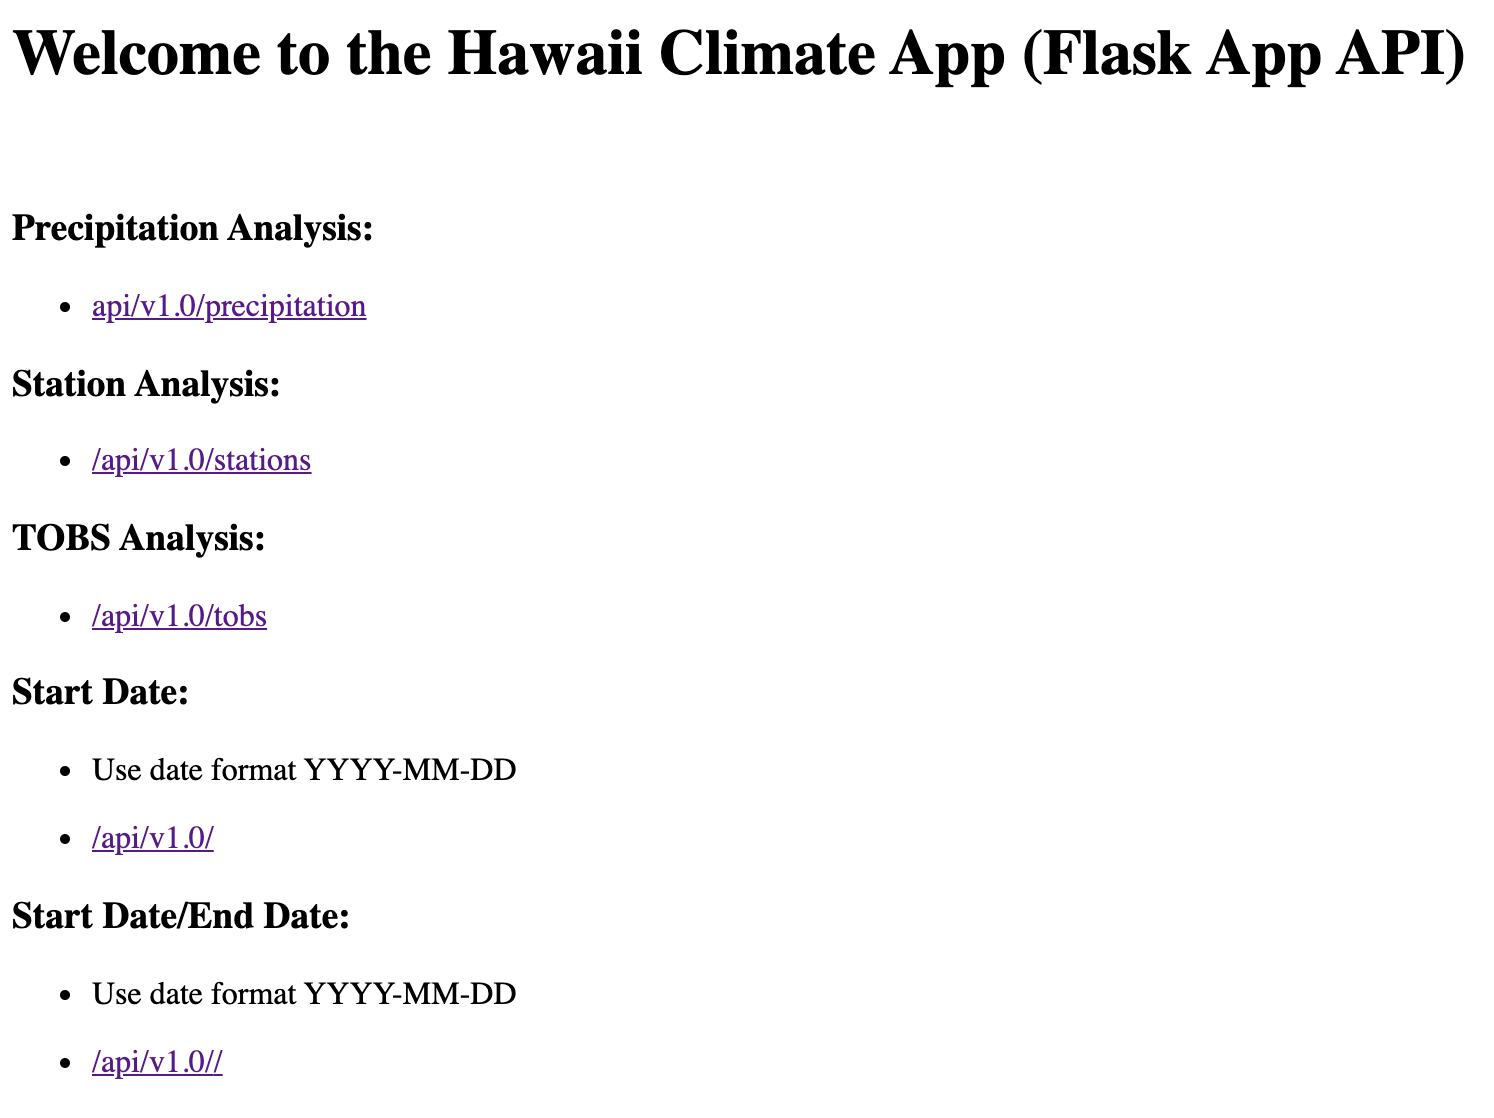
Now that you have completed your initial analysis, design a Flask API based on the queries that you have just developed.
- Use Flask to create your routes.
-
/- Home page.
- List all routes that are available.
-
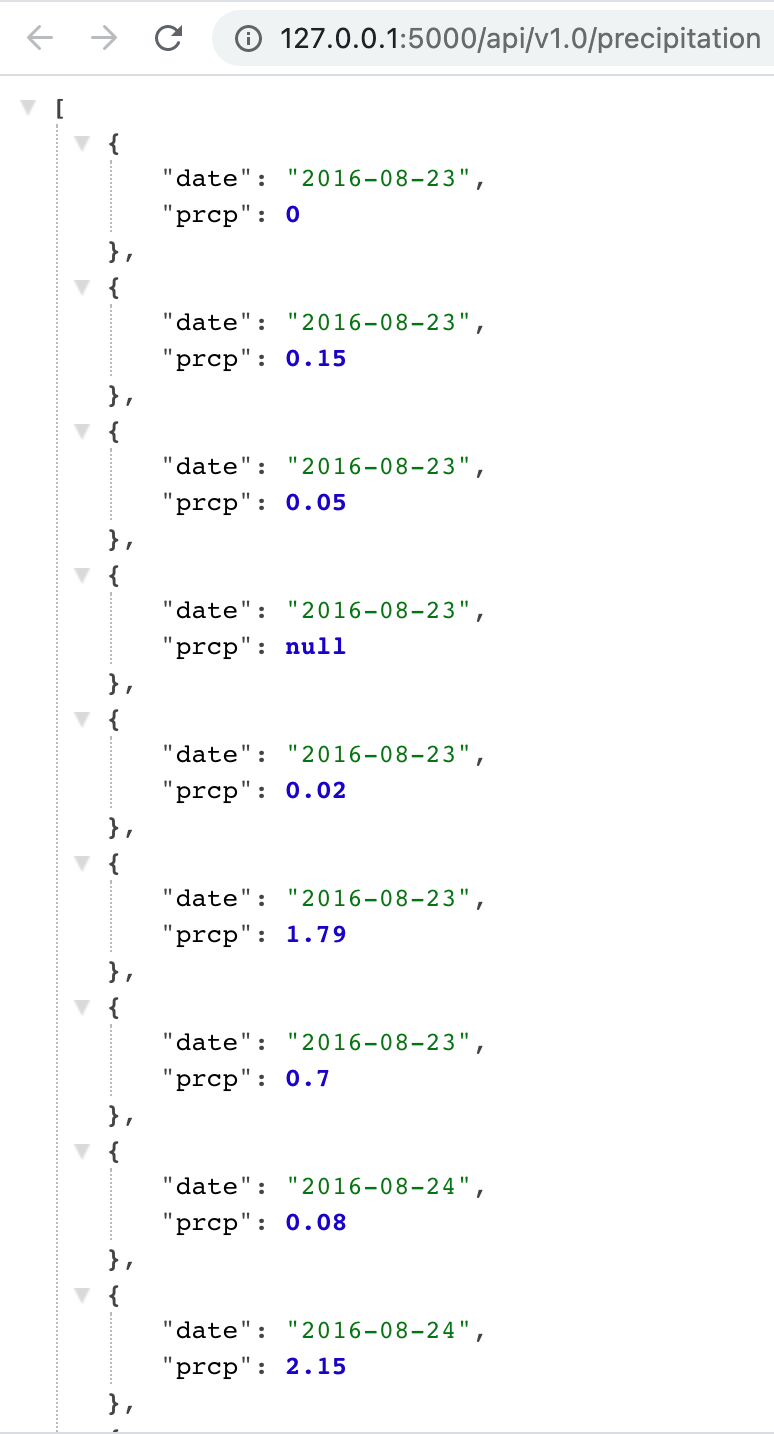
/api/v1.0/precipitation- Convert the query results to a dictionary using
dateas the key andprcpas the value. - Return the JSON representation of your dictionary.
- Convert the query results to a dictionary using
-
/api/v1.0/stations- Return a JSON list of stations from the dataset.
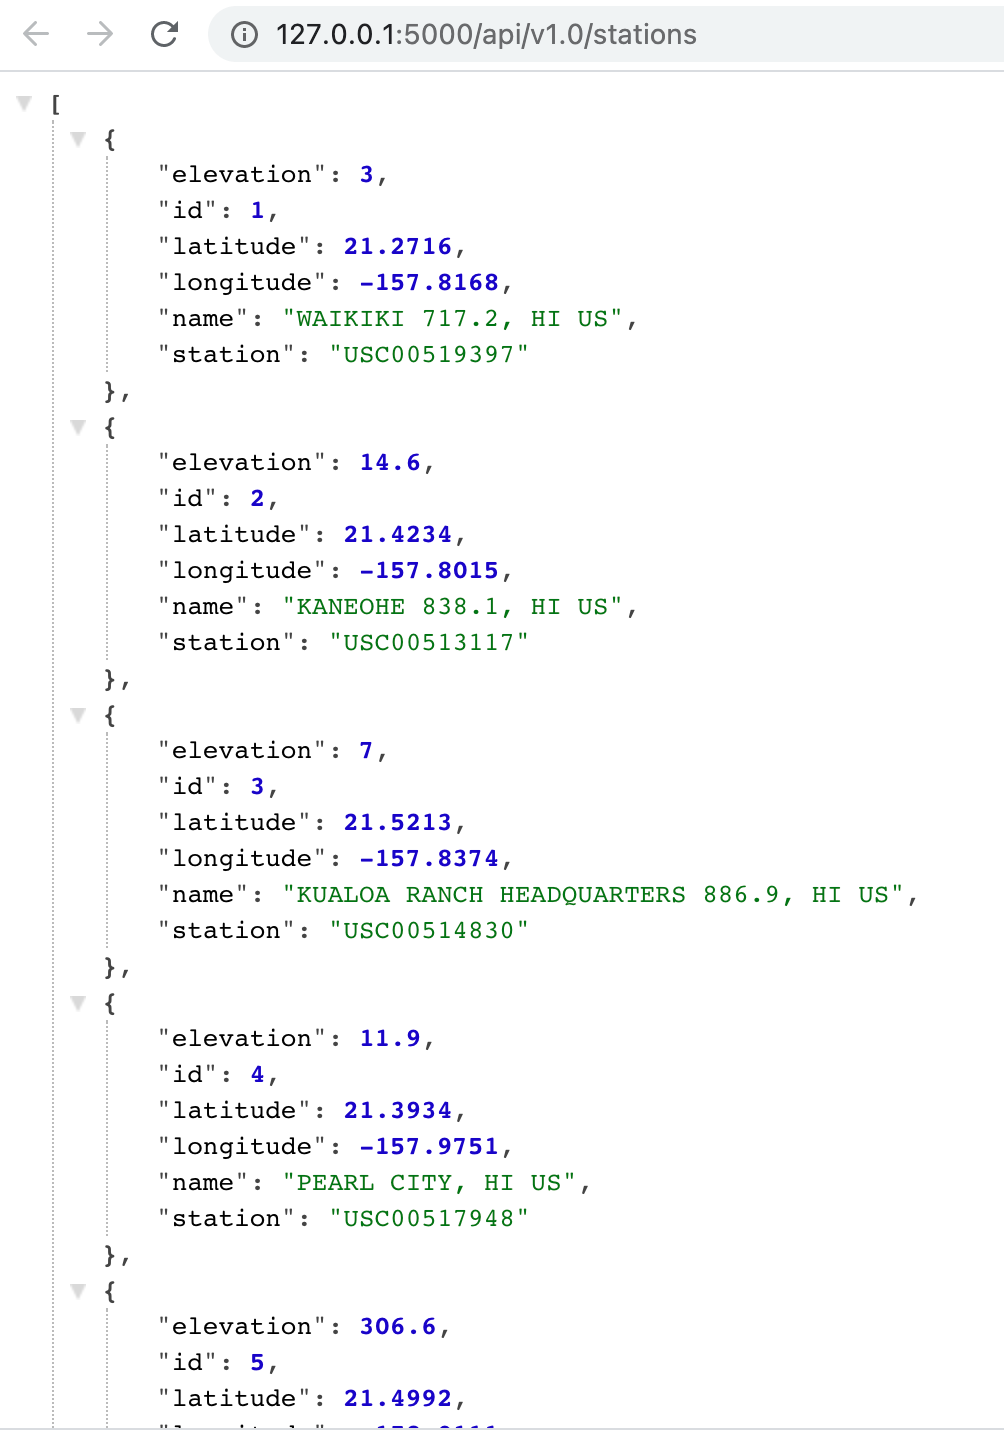
- Return a JSON list of stations from the dataset.
-
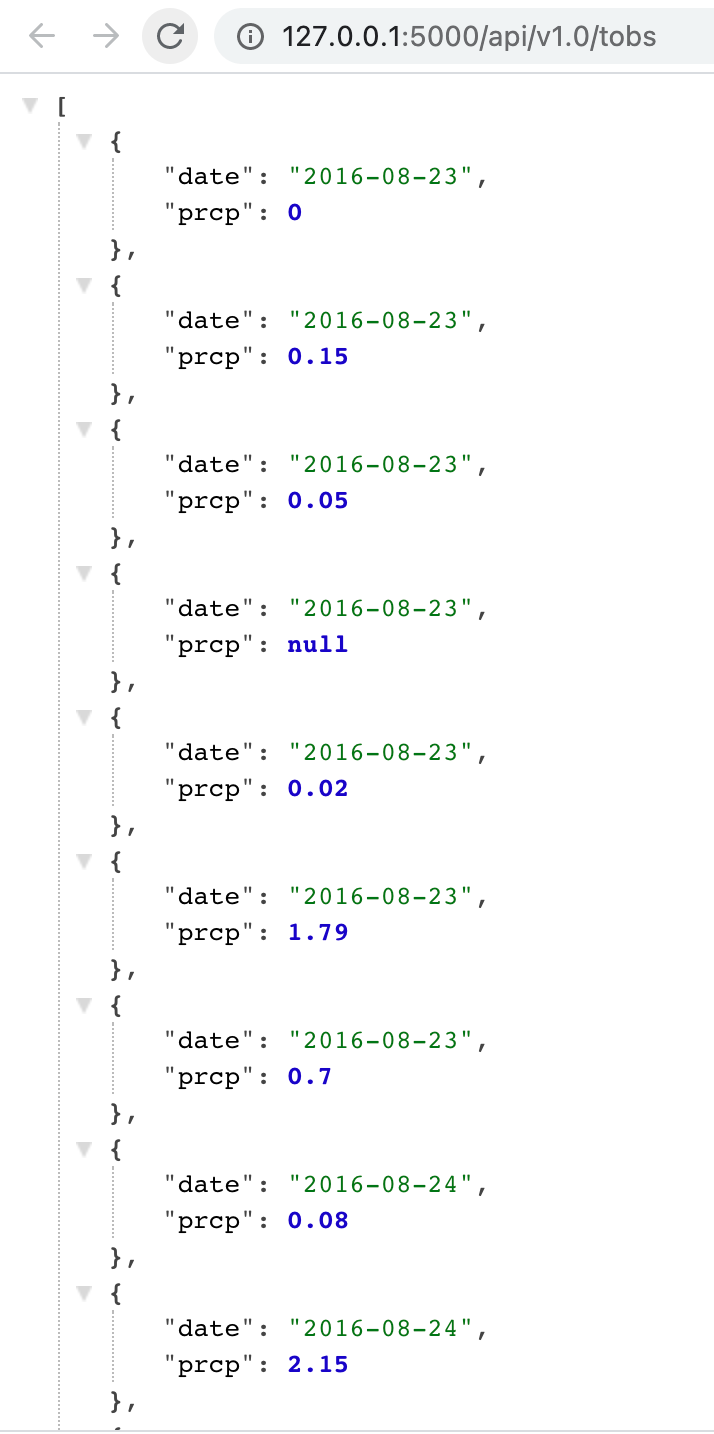
/api/v1.0/tobs- Query the dates and temperature observations of the most active station for the last year of data.
- Return a JSON list of temperature observations (TOBS) for the previous year.
-
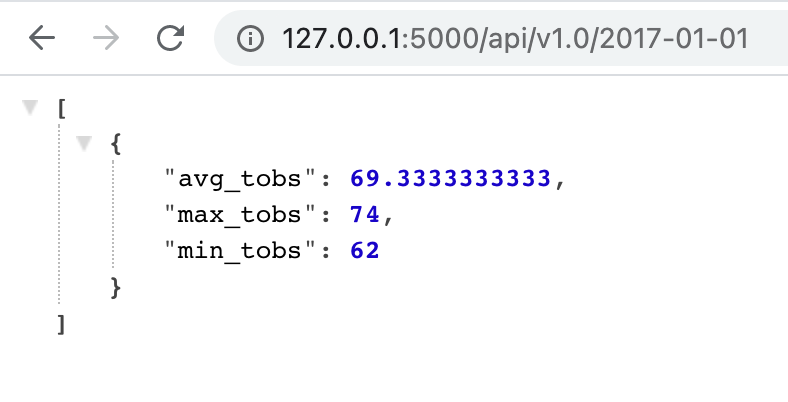
/api/v1.0/<start>and/api/v1.0/<start>/<end>- Return a JSON list of the minimum temperature, the average temperature, and the max temperature for a given start or start-end range.
- When given the start only, calculate
TMIN,TAVG, andTMAXfor all dates greater than and equal to the start date. - When given the start and the end date, calculate the
TMIN,TAVG, andTMAXfor dates between the start and end date inclusive.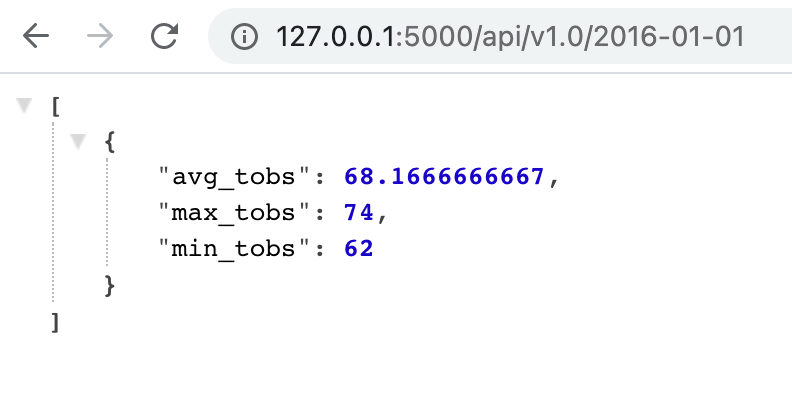


Alex Arnold © 2020. All Rights Reserved.
Alex Arnold: alexnarnold630@gmail.com