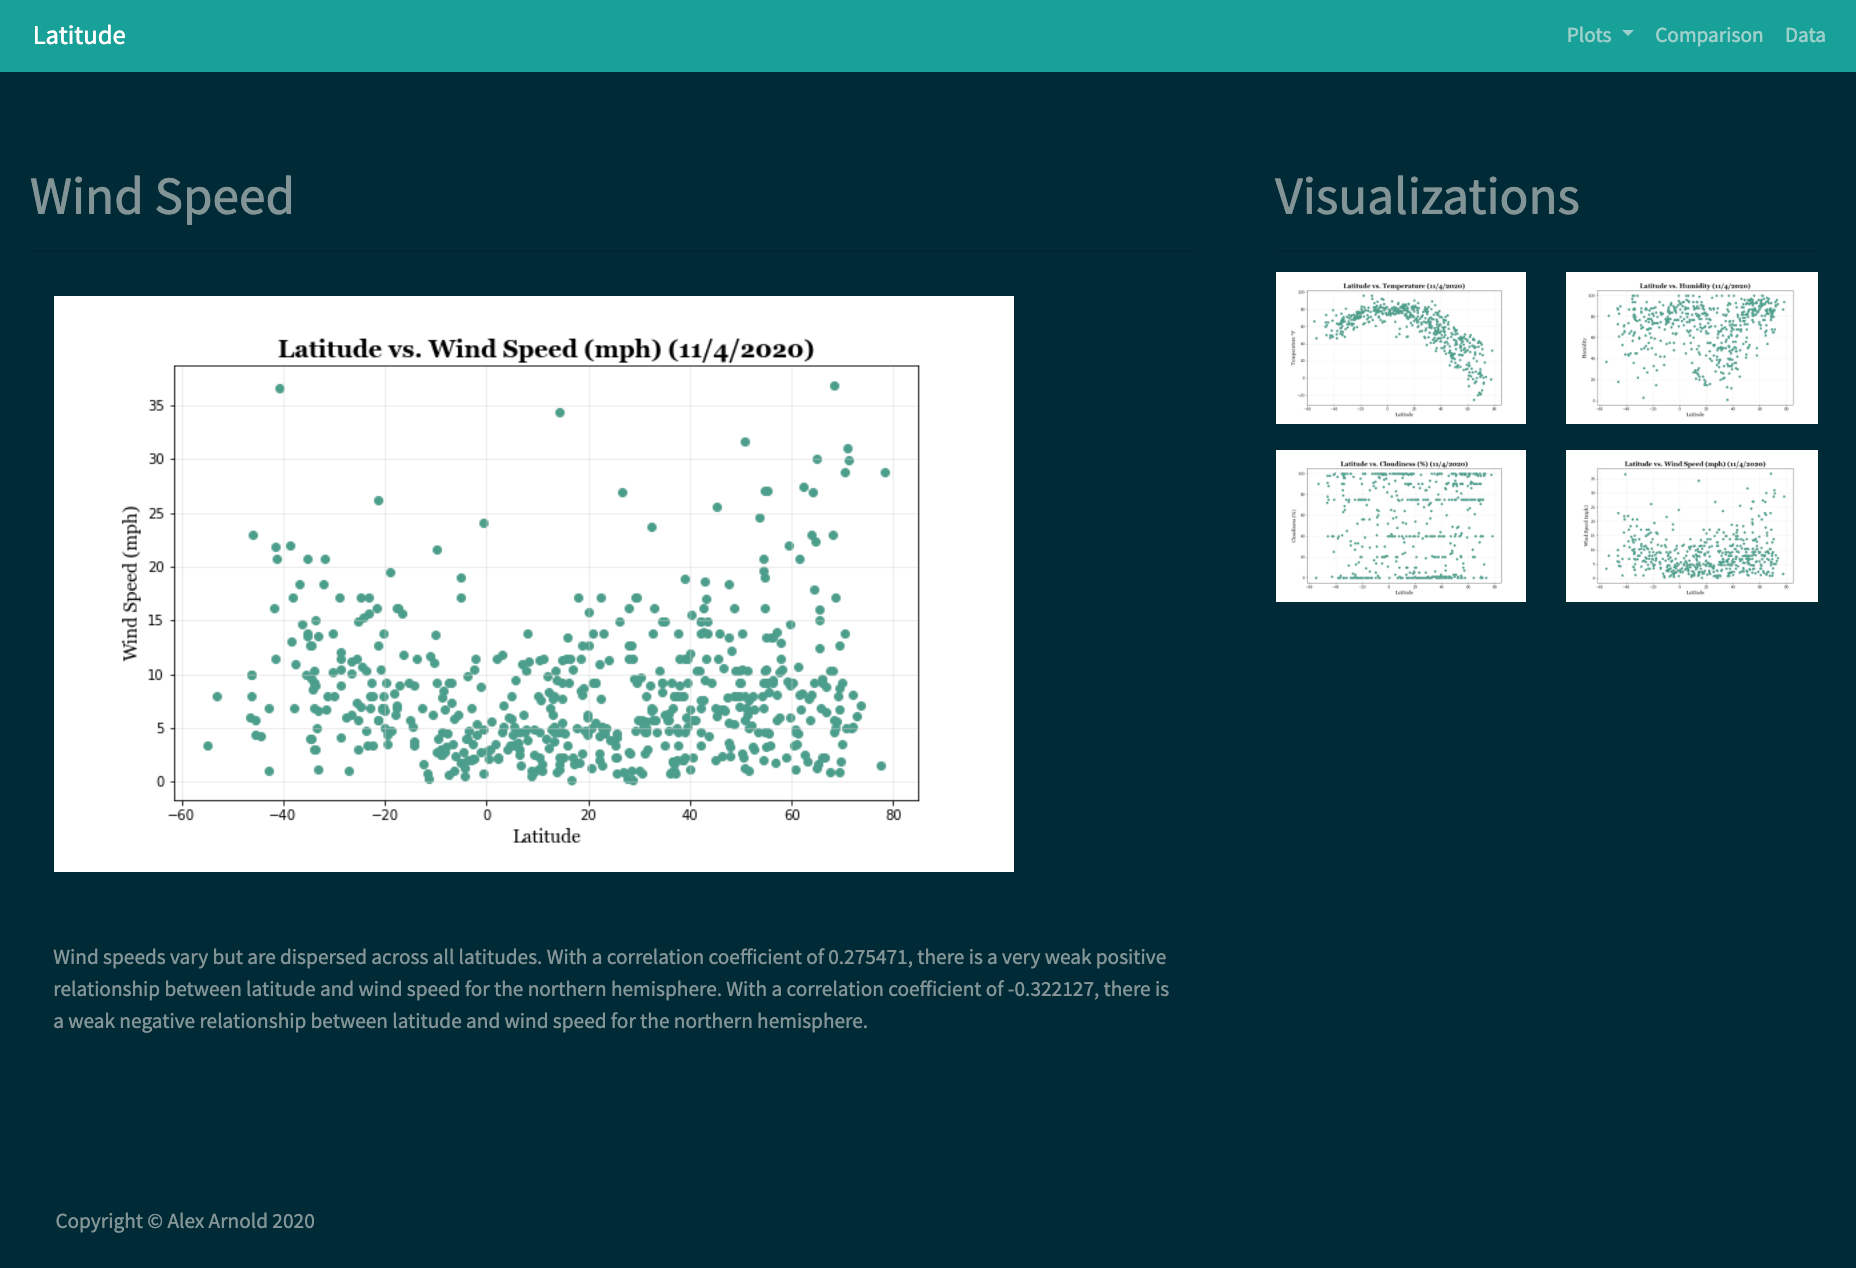
Create a visualization dashboard website of over 500 cities relative to the equator using HTML, CSS, and Bootstrap.
- HTML
- CSS
- Bootstrap
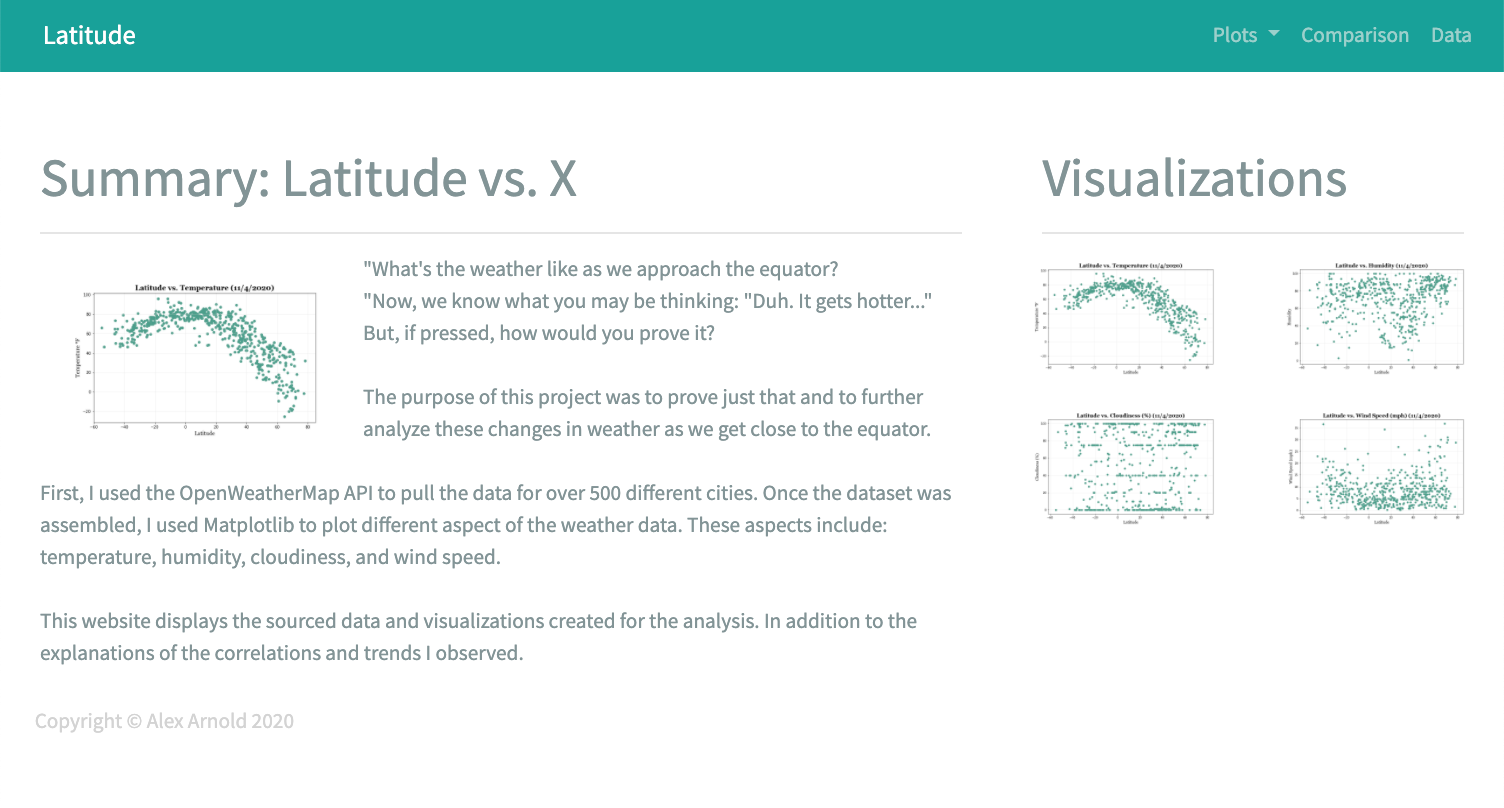
In building this dashboard, create individual pages for each plot and a means to navigate between them. These pages will contain the visualizations and their corresponding explanations. In addition, create a landing page, a page to see a comparison of all of the plots, and another page to view the data used to build them.
The website must consist of 7 pages total, including:
- A landing page containing:
- An explanation of the project.
- Links to each visualizations page. There should be a sidebar containing preview images of each plot, and clicking an image should take the user to that visualization.
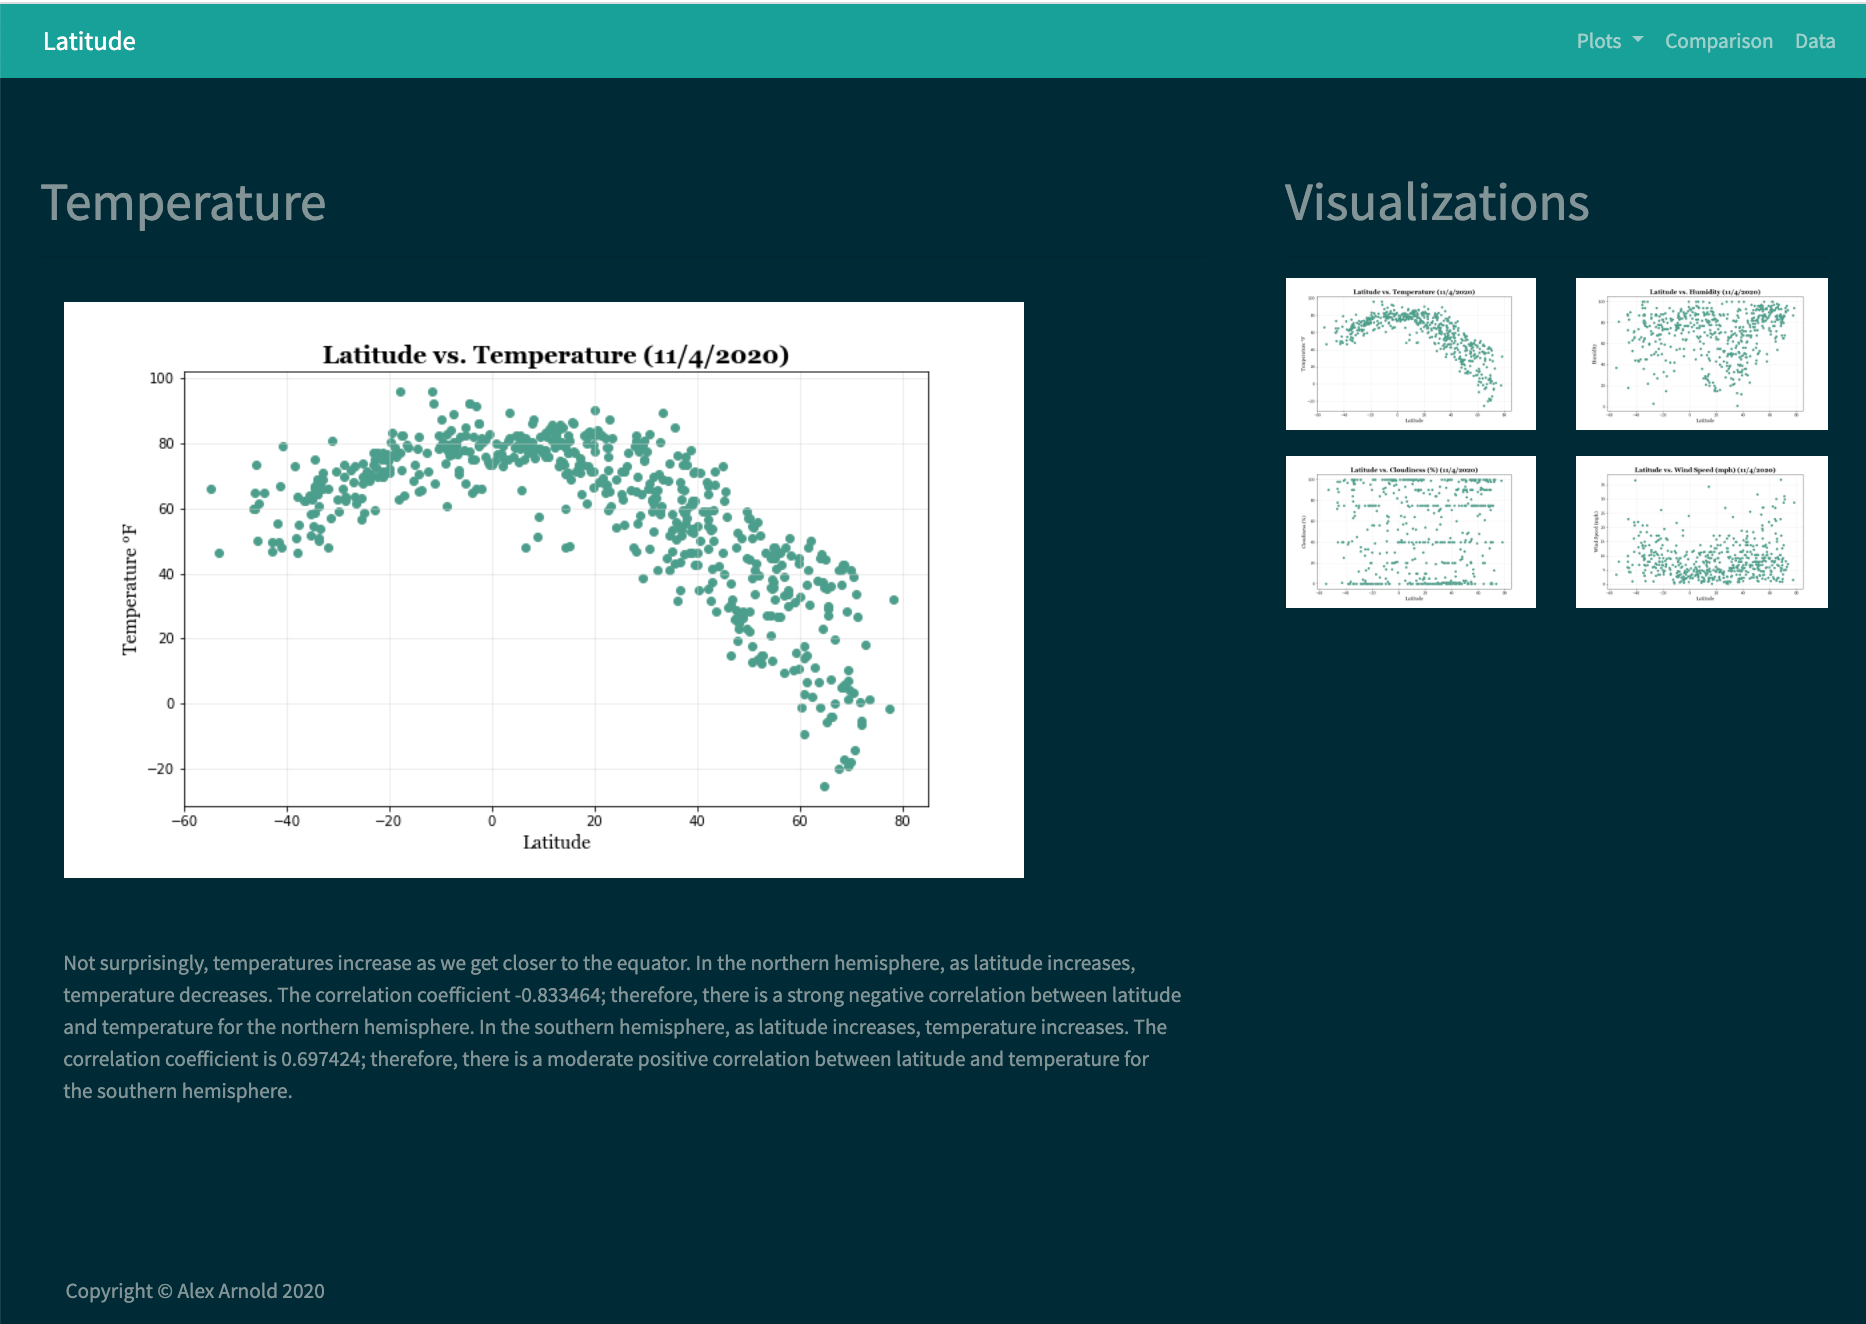
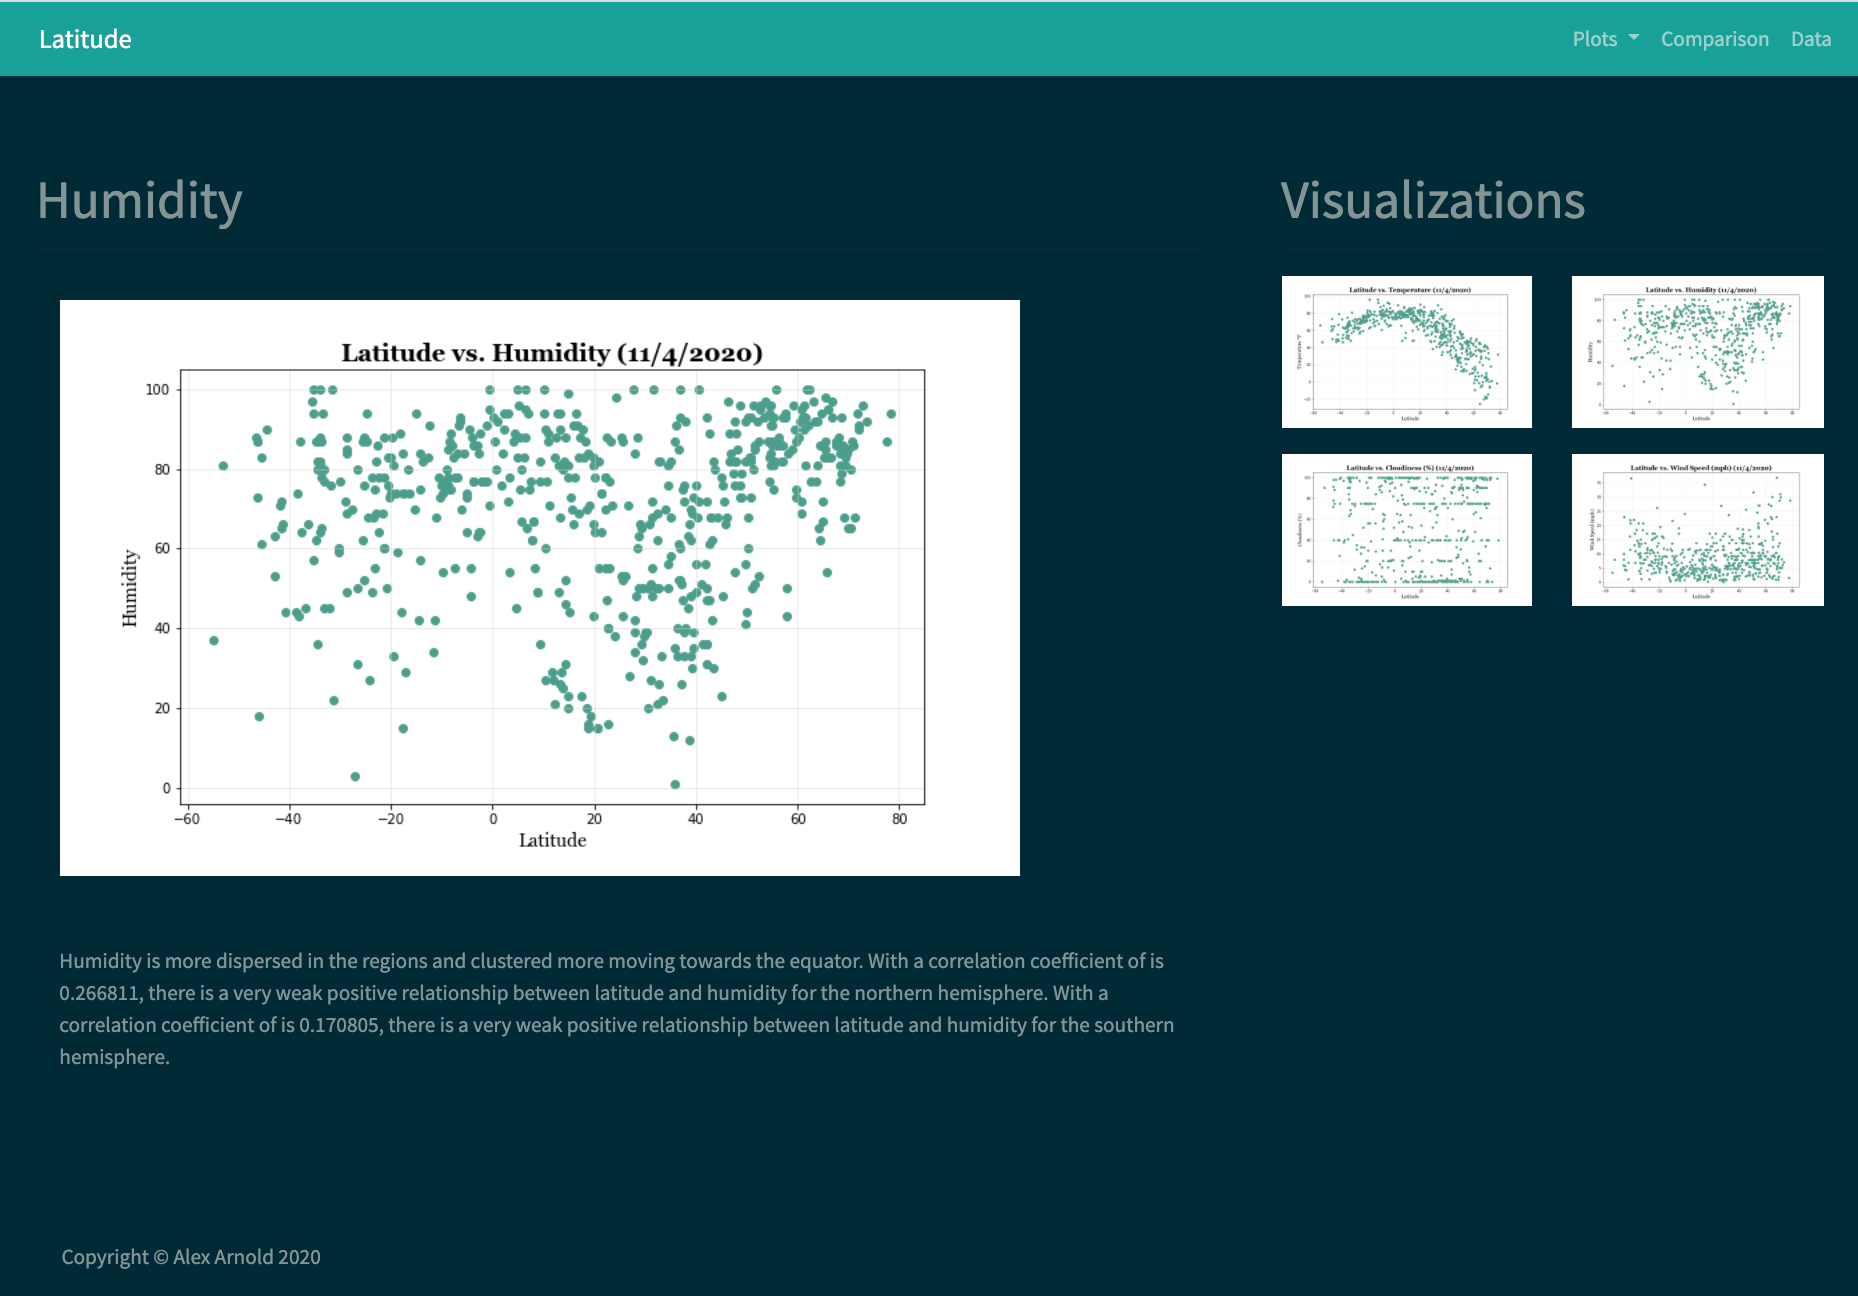
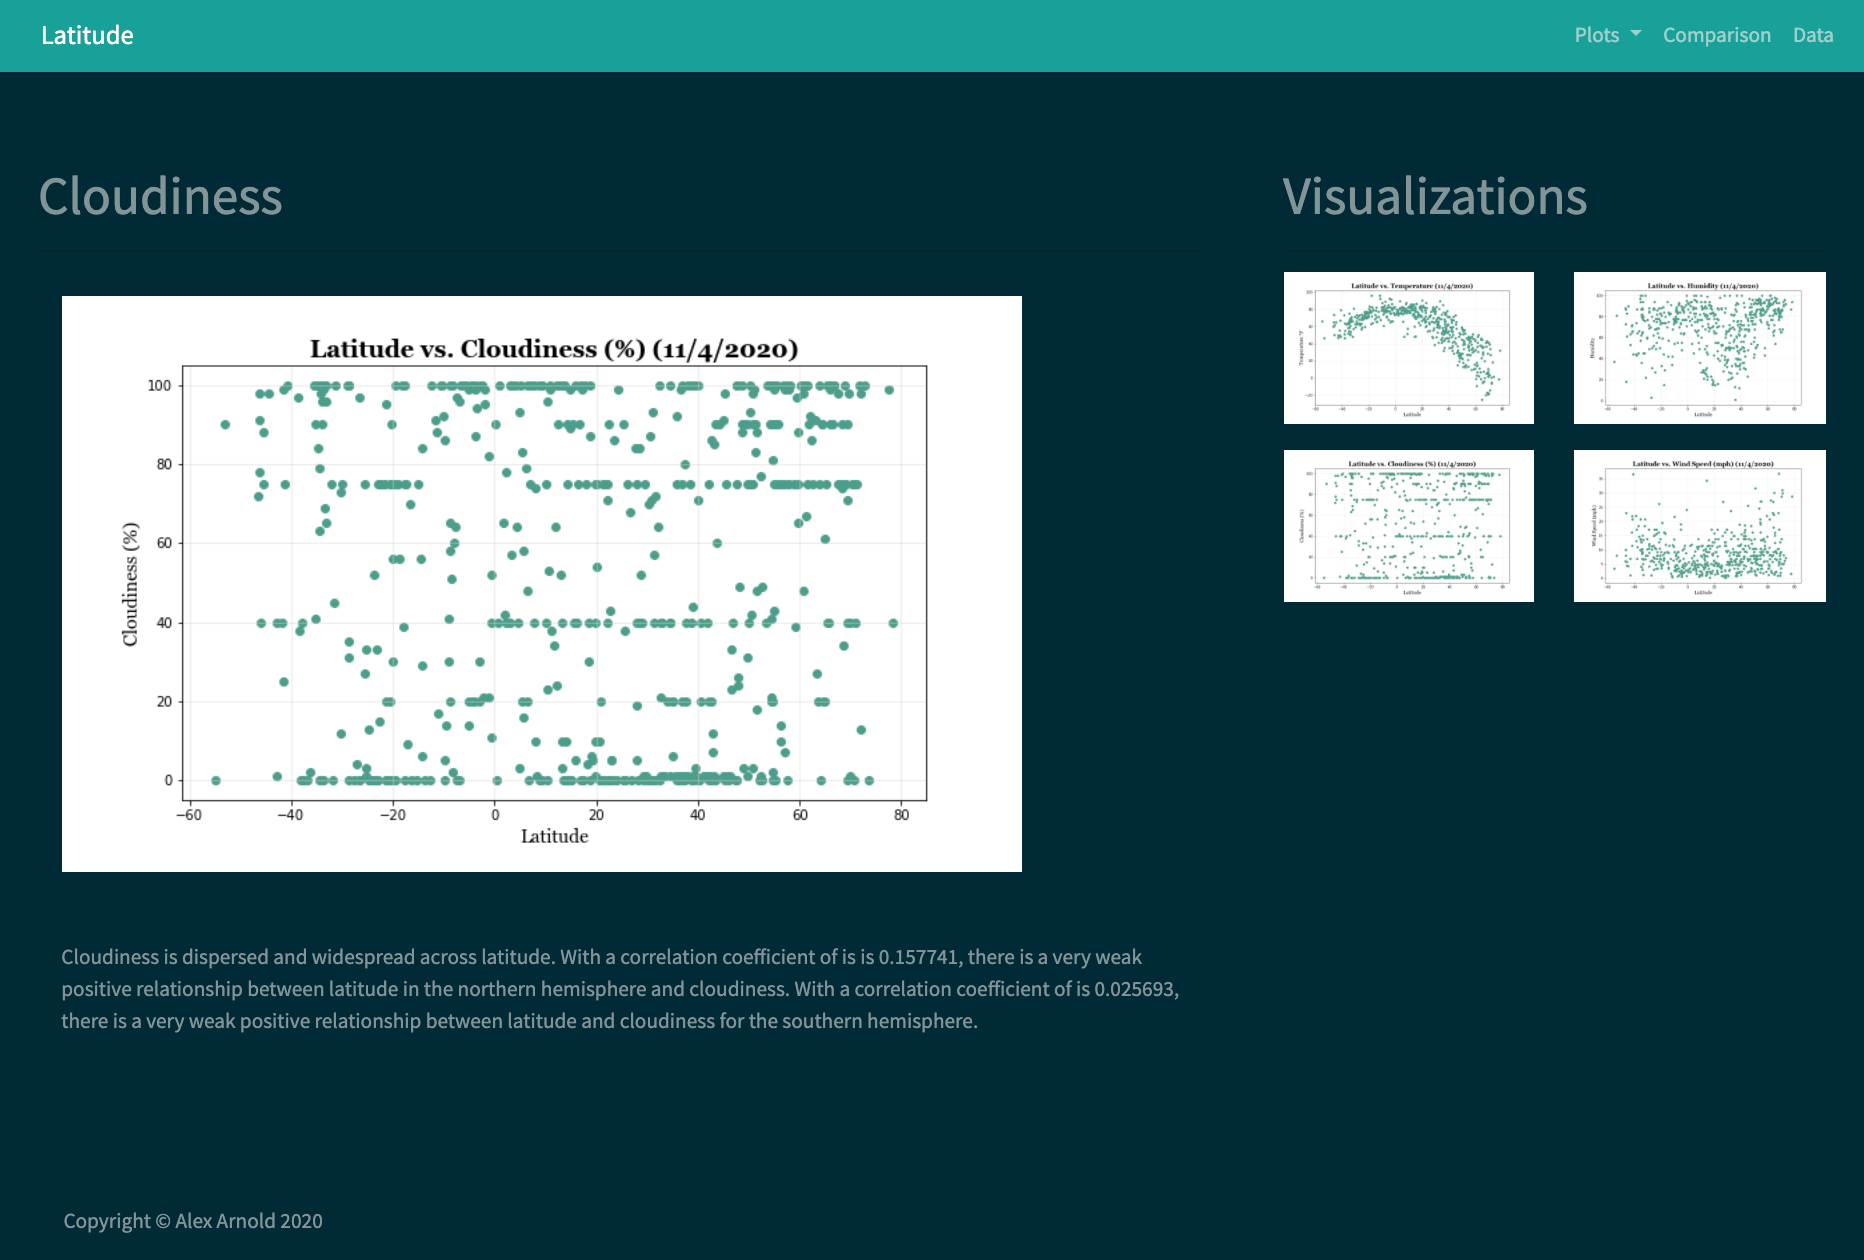
- Four visualization pages, each with:
- A descriptive title and heading tag.
- The plot/visualization itself for the selected comparison.
- A paragraph describing the plot and its significance.
- A "Comparisons" page that:
- Contains all of the visualizations on the same page so we can easily visually compare them.
- Uses a Bootstrap grid for the visualizations.
- The grid must be two visualizations across on screens medium and larger, and 1 across on extra-small and small screens.
- A "Data" page that:
- Displays a responsive table containing the data used in the visualizations.
- The table must be a bootstrap table component.
Open Weather Map API: https://openweathermap.org/api
Alex Arnold: alexnarnold630@gmail.com
