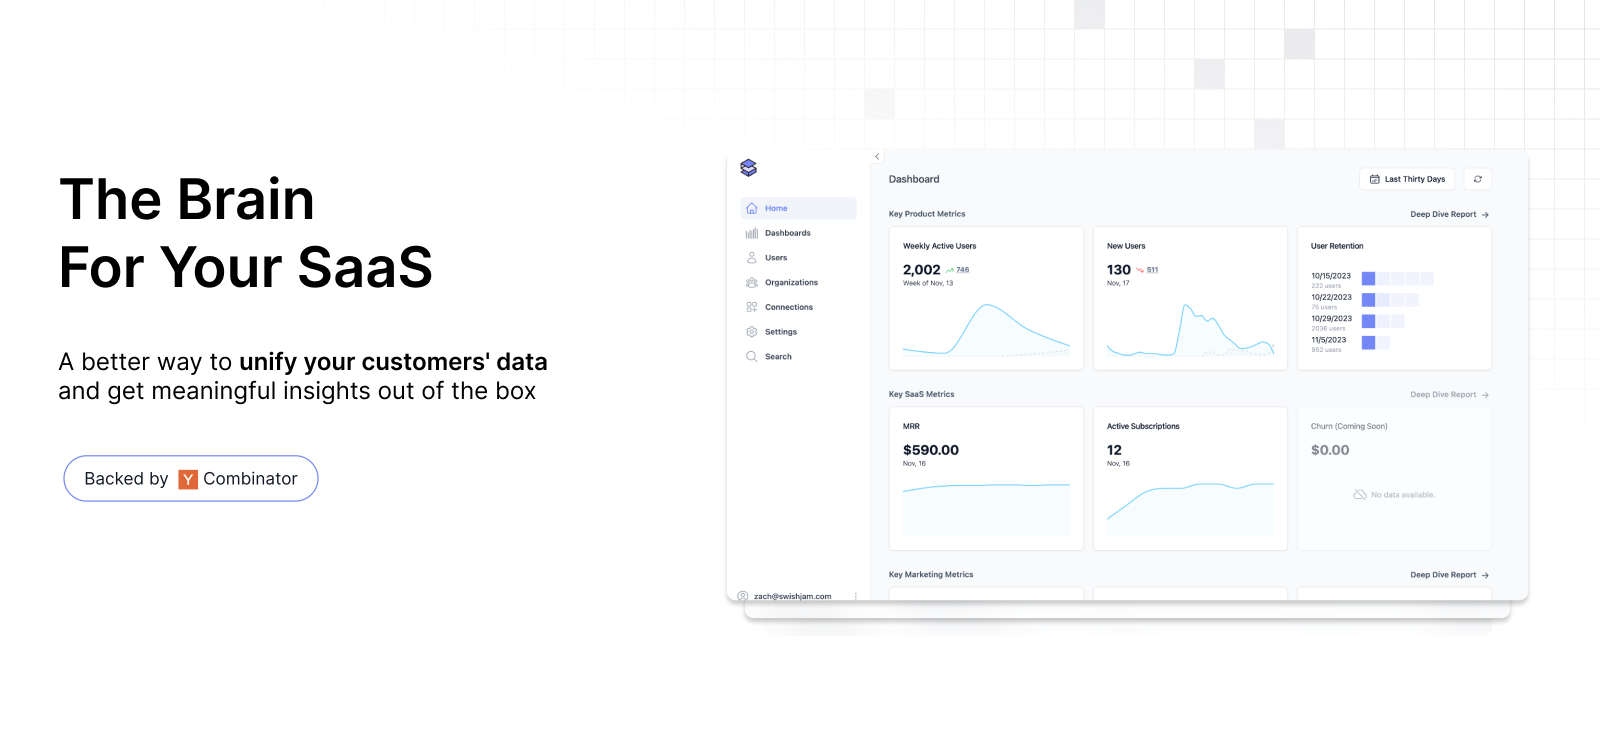
- Lightweight javascript capture of core web vitals, page load waterfalls, & more
- [Coming soon] Page loading optimization script baked in
- [Coming soon] Notifications & regression monitors
- Drop us a message to discuss upcoming features
We want everyone to build awesome web experiences. We see Swishjam becoming a collection of tools to measure, mitigate, and enhance your users experience and help it perform better.
.
├── api                   # AWS Configurations & Data handling pipline for scalable data ingest
├── database              # Manages the RDS data structure using Node.js & Sequelize
├── instrumentation       # Instrumentation code to capture performance data
├── dashboard             # [Coming soon] Visualize your user's experiences better
├── LICENSE
└── README.md
Each folder: api, database, instrumentation, and dashboard [coming soon] will have its own installation instructions. Please read the installation in each folder to get you started. We recommend setup in the following order:
- Instrumentation
- Database
- API
- Dashboard
The instrumentation directory is what houses all of the Swishjam javascript that collects your web page's performance data and sends it to the API. In order to self-host Swishjam, you must host the Swishjam JS where your host the rest of your client-side JS. In order to do this, you must:
- Run
npm installwithin the/instrumentationdirectory. - Import the
Swishjamobject from thesrc/swishjamfile (ie:import { Swishjam } from './src/swishjam). - Pass your
reportingUrland thepublicApiKeyarguments to theSwishjam.initmethod on page load. This will initialize Swishjam to begin collecting the performance data.
- The
reportingUrlis the API endpoint Swishjam will send data to (typically the API Gateway endpoint generated in the/apisetup). - The
publicApiKeyis any unique indicator for your data that your dashboard will use to visualize your data. It is not as relavant for self-hosted Swishjam implementations, but it does allow for your to send data from multiple sites to the same Swishjam instance.
Swishjam.init({
  reportingUrl: 'https://www.example.com/api/swishjam',
  publicApiKey: 'abc-789'
})
That's it. Swishjam JS will now collect and send performance data to your specific Reporting URL. Here are the other options available to you when calling the Swishjam.init method:
Swishjam.init({
  reportingUrl, // The API endpoint Swishjam will send data to (typically the API Gateway endpoint generated in the `/api` setup)
  publicApiKey, // The unique indicator for your data that your dashboard will use to visualize your data
  sampleRate, // The rate in which Swishjam should collect data. 0.5 would mean 50% of page views are captured. The default is 1 (100%).
  maxNumEventsInMemory, // How many performance events Swishjam should hold in memory before sending the data to the Swishjam API endponit, flushing the data. The default is 25.
  reportAfterIdleTimeMs, // If the `maxNumEventsInMemory` has not been met, how long in ms to hold onto the data in memory before sending it to the Swishjam API endpoint and flushing the data. The default is 10,000.
  reportingIdleTimeCheckInterval, // The interval in ms to check the idle time reporting, the default is 2,000.
  mockApiCalls, // Disable API network calls and instead just console.log the data, useful for development. Should never be used in prod.
  performanceEntryTypesToCapture, // The type of performance entries (https://developer.mozilla.org/en-US/docs/Web/API/PerformanceEntry/entryType) to capture and report on. The default is: 'navigation', 'paint', 'resource', 'longtask', 'largest-contentful-paint', 'layout-shift'.
  includeSwishjamResourcesEntries, // Whether or not to report on Swishjam API calls as performance entries. The default is false.
  shouldCapturePerformanceEntries // Disable performance entry capture entirely, and only report Core Web Vital metrics.
})The database directory is where your Postgres database is maintained. It uses Sequelize to run migrations against your DB. In order to get started you must:
- Run
npm installwithin the directory. - Update the
.env.samplewith your actual DB credentials and change the filename to.env - Run
npm run db:mto migrate your database.
The api directory is the ingestion layer of Swishjam that receives and processes all of the performance data collected by JS. It consists of:
- An AWS API Gateway endpoint that acts as the reporting endpoint instrumentation sends data to.
- An AWS SQS queue that sits between the API Gateway and the Lambda function.
- An AWS Lambda function that pulls messages from SQS, parses the data, and writes it to the Postgres DB.
The configuration is all maintained and built using an AWS CloudFormation template and the SAM framework to deploy it. In order to get started you must:
- (Install the SAM CLI)
- Run
npm installin the/apidirectory. - Run
npm run guided-deployto deploy the AWS services to your specified AWS account.
- The CLI will prompt your for various configuration options (ie: Database host, Database username, etc...) required to run the AWS services.
- Use the created API Gateway endpoint as your reporting URL in instrumentation.
- The Swishjam Reporting API URL is outputted in the console. Use this value as the
reportingUrloption in yourSwishjam.initJS method.
- Send us a PR, github issue, or email at founders@tagsafe.io
- Collin Schneider (@CollinSchneid)
- Zach Zimbler (@zzimbler)
MIT License
