Nitrogen dioxide (NO2) enters the atmosphere as a result of anthropogenic activities such as fossil fuel combustion and biomass burning, as well as natural processes including microbiological processes in soils, wildfires and lightning (Sentinel-5P Nitrogen Dioxide, Google Earth Engine Data Catalog).
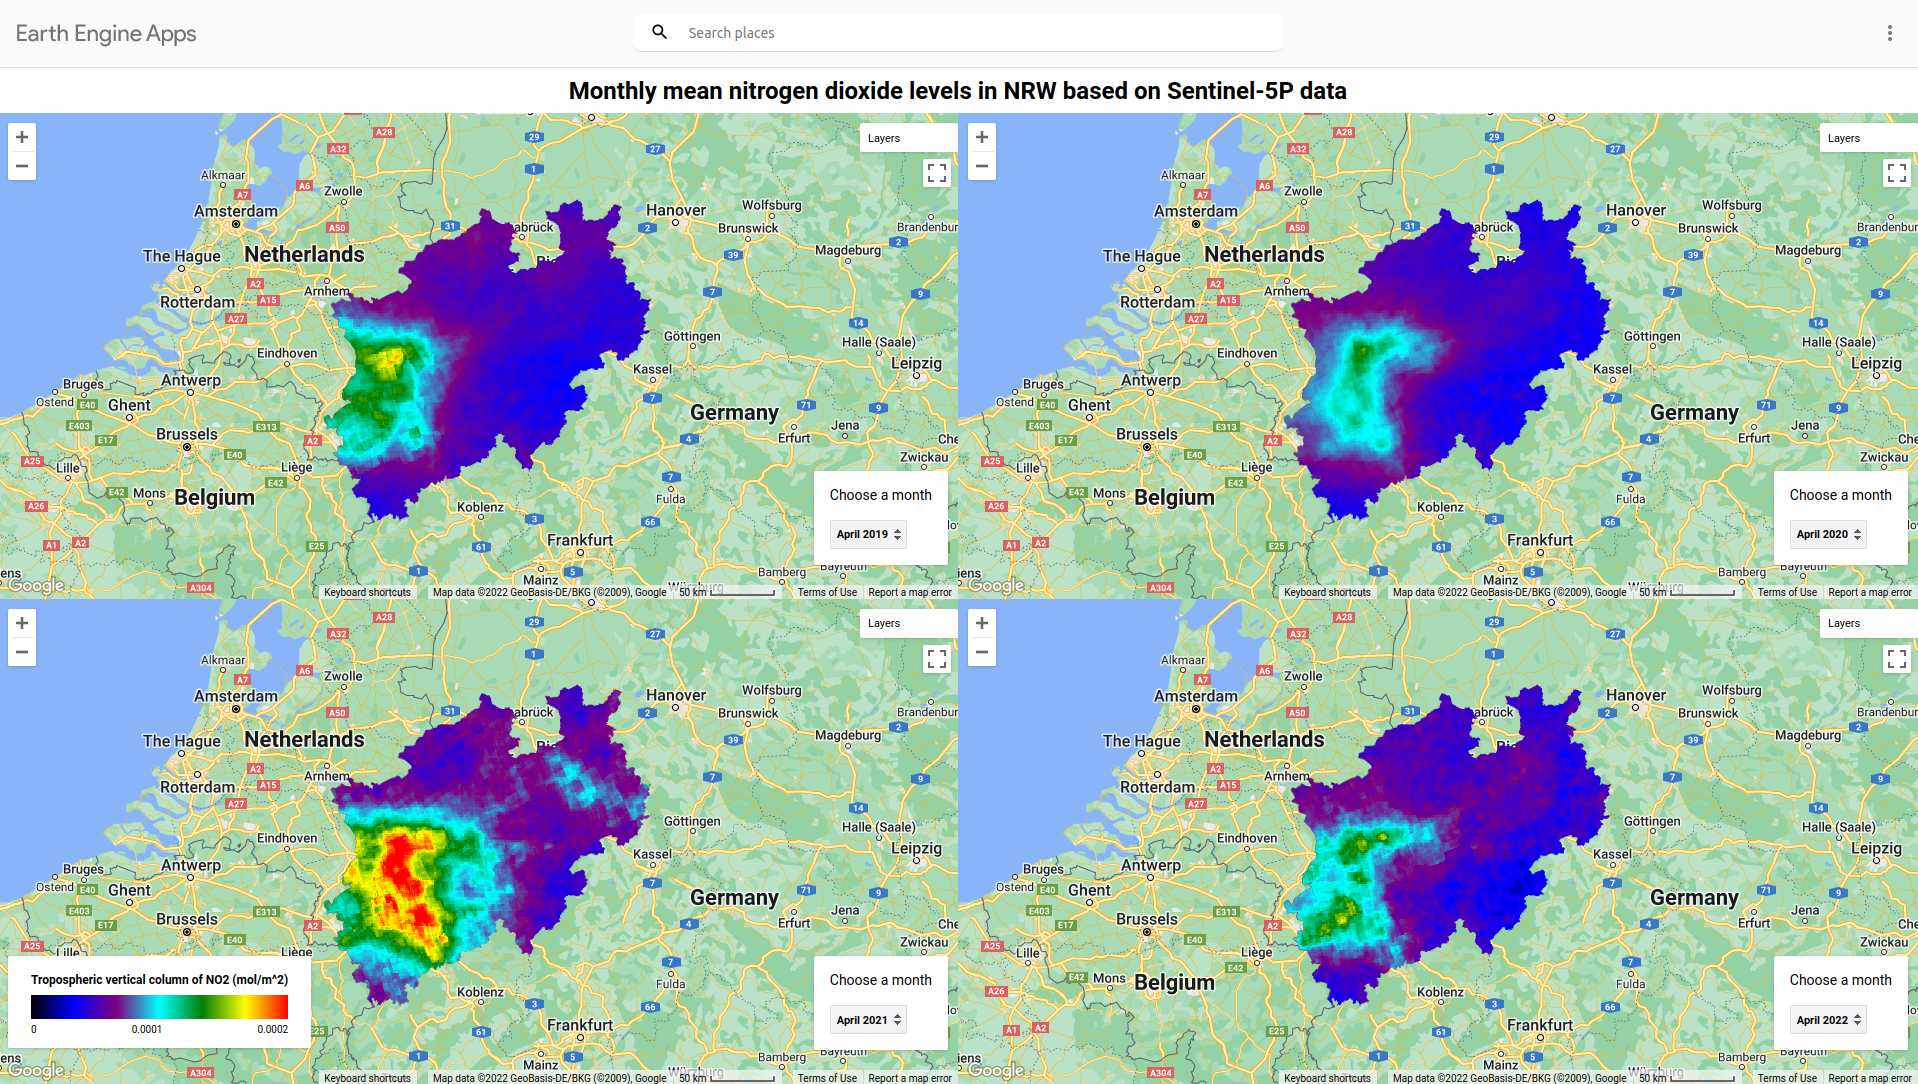
The exemplary map below shows mean NO2 levels in April 2019, 2020, 2021 and 2022 in NRW. Especially the Ruhr area and densly populated cities like Cologne and Düsseldorf show higher NO2 levels. April 2021 also shows comparably higher NO2 levels compared to other years - what could be the reason?
Sentinel-5P NO2 data has a resolution of 1113.2 meters.
The map can be further explored in Earth Engine using this link to Earth Engine Apps or this link to the Code Editor.
You can use the layer control to change the opacity of the NO2 layer to see which places exhibit particularily high NO2 levels.
- add other air quality indicators, such as ozone, methane, formaldehyde, aerosol, carbon monoxide and sulphur dioxide -> complicated to implement under current setup
- add other German states -> complicated to implement under current setup
- understand how Sentinel-5P NO2 levels measured in mol/m^2 relate to official EU limits of 40 μg/m^3
