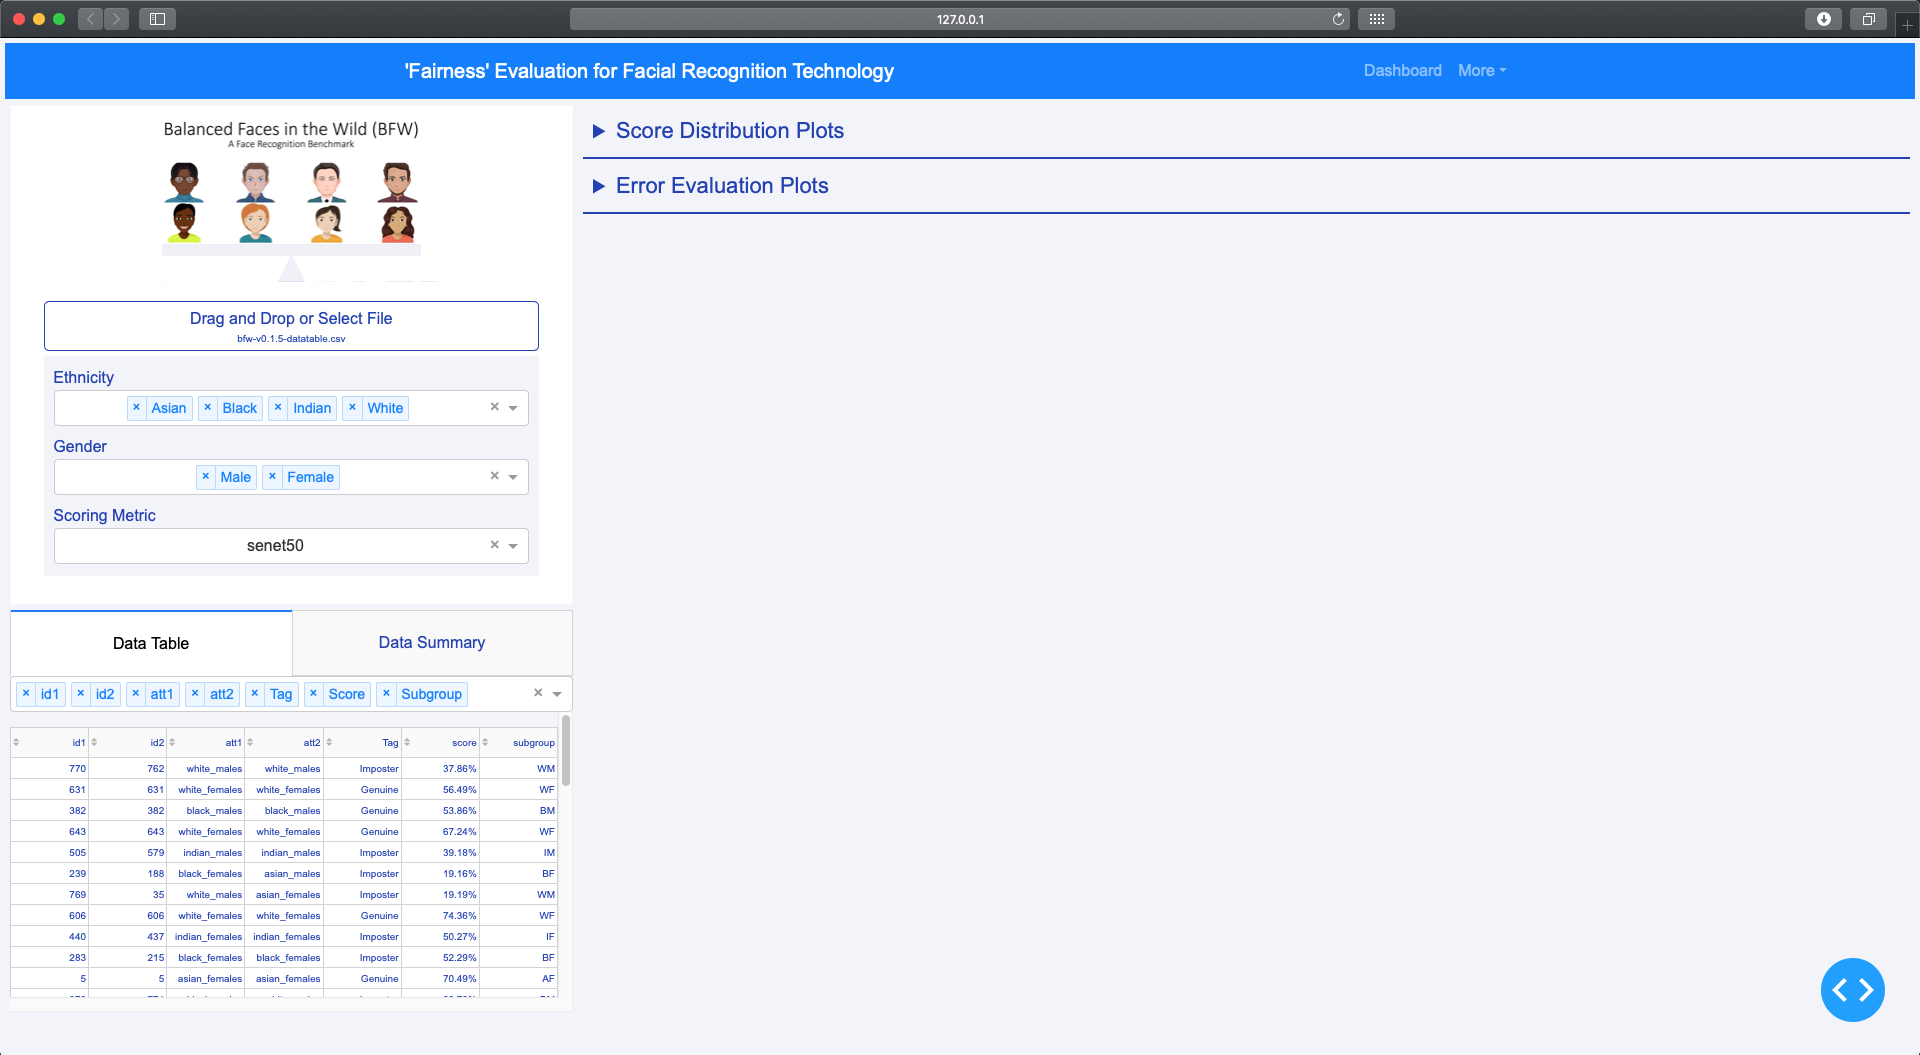
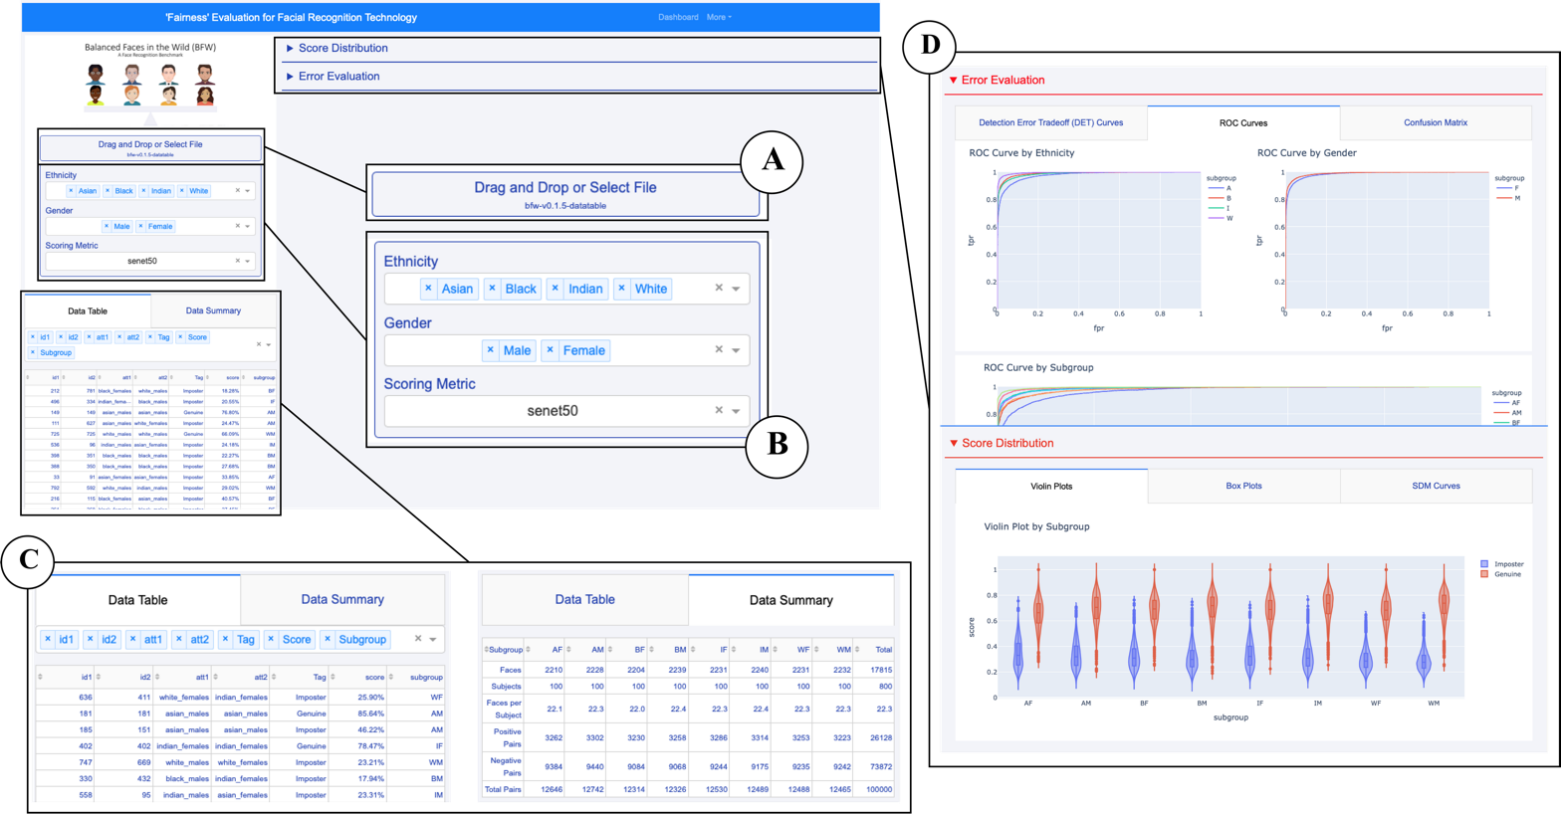
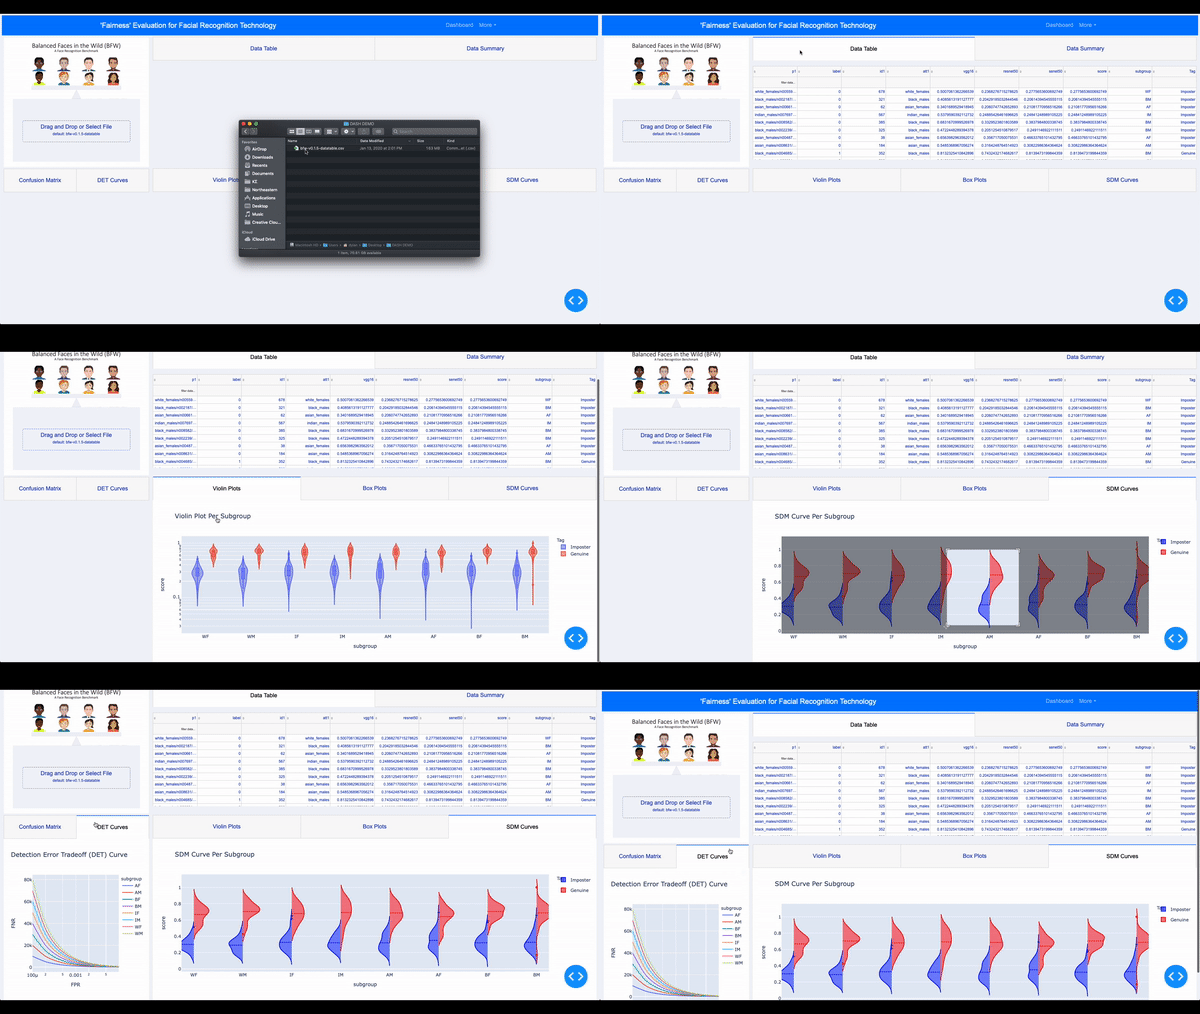
The Balanced Faces in the Wild Dashboard is a tool for users to find bias in their facial recognition models.
- Code/Installation
- Research, Innovation, and Scholarship Expo
- Key Terms
- Visualizations
- User Interface
- Skeleton
For installation and .py files visit this Github repo:
https://github.com/ddasgupta4/bfw-dash
For a closer look at the code and motivations visit this Github repo: https://github.com/visionjo/facerec-bias-bfw
- The research paper: https://github.com/aliceloukianova/bias-dash/blob/master/A%20Fairness%20Tool%20for%20Bias%20in%20FR.pdf
- The poster: https://github.com/aliceloukianova/bias-dash/blob/master/EECE2300-BIAS-RISE-2020-POSTER.pdf
- The presentation: https://prezi.com/js6eygtyapjl/rise-2020-bias-in-fr-technology
- The recording of the presentation: https://github.com/aliceloukianova/bias-dash/blob/master/Video%20Presentation.md
True Positive/Sensitivity: Measures the proportion of actual positives that are correctly identified as such.
True Negative/Specificity: Measures the proportion of actual negatives that are correctly identified as such.
False Positive: When the prediction is positive and it’s false, this is a Type 1 Error.
False Negative: When the prediction is negative and it’s false, this is a Type 2 Error.
SDM Curve: A violin plot showing a distribution of scores, using imposter and genuine scores against each other displaying the overlap between the two.
DET Curve: Detection error trade off curve plots the false negative rate (FNR) as a function of the false positive rate (FPR). A tool to see the tradeoff between the sensitivity and specificity of the FR model.
ROC Curve: Receiever operating characteristic curve plots the true positive rate (TPR) against the false positive rate (FPR).
Confusion Matrix: Measures recall, precision, specificity, and accuracy in a model.
Recall: Measures how much was correctly predicted out of all the positive cases.
Precision: Looks at how many cases are truly positive out of the positive ones predicted correctly.
Specificity: Measures correctness of the true negative rate.
Accuracy: Measures much was predicted correctly out of all the classes.
All vizualizations featured in the Dashboard can be found here: https://github.com/aliceloukianova/bias-dash/tree/master/Visualizations
This includes a Signal Detection Model , Detection Error Tradeoff (DET) Curves, Receiver Operating Characteristic (ROC) Curves, and a Confusion Matrix.
├── LICENSE
├── Makefile           <- Makefile with commands like `make data` or `make train`
├── README.md          <- The top-level README for developers using this project.
├── data
│   ├── external       <- Data from third party sources.
│   ├── interim        <- Intermediate data that has been transformed.
│   ├── processed      <- The final, canonical data sets for modeling.
│   └── raw            <- The original, immutable data dump.
│
├── docs               <- A default Sphinx project; see sphinx-doc.org for details
│
├── models             <- Trained and serialized models, model predictions, or model summaries
│
├── notebooks          <- Jupyter notebooks. Naming convention is a number (for ordering),
│                         the creator's initials, and a short `-` delimited description, e.g.
│                         `1.0-jqp-initial-data-exploration`.
│
├── references         <- Data dictionaries, manuals, and all other explanatory materials.
│
├── reports            <- Generated analysis as HTML, PDF, LaTeX, etc.
│   └── figures        <- Generated graphics and figures to be used in reporting
│
├── requirements.txt   <- The requirements file for reproducing the analysis environment, e.g.
│                         generated with `pip freeze > requirements.txt`
│
├── setup.py           <- makes project pip installable (pip install -e .) so src can be imported
├── src                <- Source code for use in this project.
│   ├── __init__.py    <- Makes src a Python module
│   │
│   ├── data           <- Scripts to download or generate data
│   │   └── make_dataset.py
│   │
│   ├── features       <- Scripts to turn raw data into features for modeling
│   │   └── build_features.py
│   │
│   ├── models         <- Scripts to train models and then use trained models to make
│   │   │                 predictions
│   │   ├── predict_model.py
│   │   └── train_model.py
│   │
│   ├── visualization  <- Scripts to create exploratory and results oriented visualizations
│   |   └── visualize.py
│   │
│   └── evaluation  <- Scripts to evaluate data metrics
│       └── metrics.py
│
└── tox.ini            <- tox file with settings for running tox; see tox.testrun.org
Project based on the cookiecutter data science project template. #cookiecutterdatascience


