- Architecture
- Installation methods
- Answering the Questions
- Scale project
- Create topic or Scale topic partition
- Terraform
- SQL Schema
- Server Spec
This is picture of project architecture.
- We have 3 node zookeeper cluster
- We have 3 node Kafka broker
- We use Clickhouse as a big-data database
- For analytics dashboard using Metabase
- Metabase needs a database to store service users, queries, and dashboards and we use PostgreSQL as a database
- For monitoring the Kafka cluster use Kafka-UI
- Develop producer with python
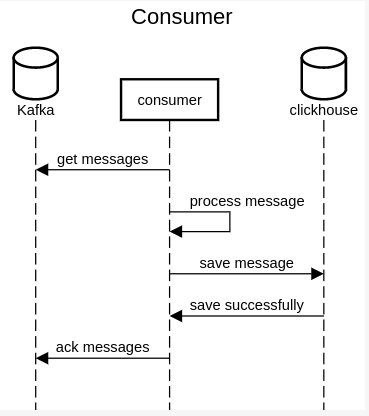
- Develop consumer with python
- Develop a web application that has REST API to answer the questions with Python FastAPI
For working with this repository we need install Docker and Docker Compose
You can install project in different ways:
Clone project
git clone https://github.com/alirezabe/rikstv-interview .Set permition
chmod +x ./build-all.shRun build script
./build-all.shAfter that we have 3 images.
you can see them with:
docker imagesThe result should be like:
`
REPOSITORY                                 TAG              IMAGE ID       CREATED         SIZE
app                                        latest           115e340f0141   5 hours ago     388MB
producer                                   latest           de61f05ff6ca   5 hours ago     218MB
consumer                                   latest           5accf2becc67   5 hours ago     218MB
Go to infra Directory and check two env files:
In .env_app file we have this keys:
CLICKHOUSE_HOST=clickhouse-server
CLICKHOUSE_PORT=8123
CLICKHOUSE_USER=default
CLICKHOUSE_PASSWORD=
CLICKHOUSE_DB=rikstv
CLICKHOUSE_TABLE=data_series| Environment Name | Description | Defualt value |
|---|---|---|
| CLICKHOUSE_HOST | we setup all service in single docker network so we can address them with service_name if setup it in bare system use IP insted | clickhouse-server |
| CLICKHOUSE_PORT | port of clickhost | 8123 |
| CLICKHOUSE_USER | clickhost username | default |
| CLICKHOUSE_PASSWORD | default password is null | NULL |
| CLICKHOUSE_DB | costume database name | rikstv |
| CLICKHOUSE_TABLE | costume table name | data_series |
In .env_kafka file we have this keys:
KAFKA_TOPIC_NAME=conjecture.data
KAFKA_GROUP_ID=matine
VAULT_TOKEN='TOKEN'
VAULT_PATH='["producers"]'
PARTITIONS=4
REPLICATION_FACTOR=3
BOOTSTRAP_SERVERS=kafka1:9092,kafka2:9093,kafka:9094
CLICKHOUSE_HOST=clickhouse-server
CLICKHOUSE_PORT=8123
CLICKHOUSE_USER=default
CLICKHOUSE_PASSWORD=
CLICKHOUSE_DB=rikstv
CLICKHOUSE_TABLE=data_series| Environment Name | Description | Default value |
|---|---|---|
| KAFKA_TOPIC_NAME | Kafka topic name | conjecture.data |
| KAFKA_GROUP_ID | Producer group id | matine |
| VAULT_TOKEN | Vault token (not use in example) | TOKEN |
| VAULT_PATH | Vault paths that service can find secrets value (not use in example) | ["producers"] |
| PARTITIONS | Number of kafka topic partitions | 4 |
| REPLICATION_FACTOR | Number of replication of Topic in Brokers | 3 |
| BOOTSTRAP_SERVERS | List of all brokers | kafka1:9092,kafka2:9093,kafka:9094 |
| CLICKHOUSE_HOST | we setup all service in single docker network so we can address them with service_name if setup it in bare system use IP instead | clickhouse-server |
| CLICKHOUSE_PORT | port of Clickhost | 8123 |
| CLICKHOUSE_USER | Clickhost username | default |
| CLICKHOUSE_PASSWORD | default password is null | NULL |
| CLICKHOUSE_DB | costume database name | rikstv |
| CLICKHOUSE_TABLE | costume table name | data_series |
Go to infra directory and run docker-compose file
docker-compose up -dAfter download in running containers we can get running containers with following command
docker-compose psThe result should be like this:
      Name                     Command                  State                                                    Ports
--------------------------------------------------------------------------------------------------------------------------------------------------------------------
clickhouse-server   /entrypoint.sh                   Up             0.0.0.0:18123->8123/tcp,:::18123->8123/tcp, 0.0.0.0:19000->9000/tcp,:::19000->9000/tcp, 9009/tcp
infra_app_1         uvicorn main:app --host 0. ...   Up             0.0.0.0:8000->80/tcp,:::8000->80/tcp
infra_consumer_1    python3 consumer.py              Up
infra_producer_1    python3 producer.py              Up
kafka-ui            /bin/sh -c java --add-open ...   Up             0.0.0.0:8080->8080/tcp,:::8080->8080/tcp
kafka1              /etc/confluent/docker/run        Up             0.0.0.0:29092->29092/tcp,:::29092->29092/tcp, 0.0.0.0:9092->9092/tcp,:::9092->9092/tcp
kafka2              /etc/confluent/docker/run        Up             0.0.0.0:29093->29093/tcp,:::29093->29093/tcp, 9092/tcp, 0.0.0.0:9093->9093/tcp,:::9093->9093/tcp
kafka3              /etc/confluent/docker/run        Up             0.0.0.0:29094->29094/tcp,:::29094->29094/tcp, 9092/tcp, 0.0.0.0:9094->9094/tcp,:::9094->9094/tcp
metabase            /app/run_metabase.sh             Up (healthy)   0.0.0.0:3000->3000/tcp,:::3000->3000/tcp
postgres            docker-entrypoint.sh postgres    Up             5432/tcp
zoo1                /etc/confluent/docker/run        Up             0.0.0.0:2181->2181/tcp,:::2181->2181/tcp, 2888/tcp, 3888/tcp
zoo2                /etc/confluent/docker/run        Up             2181/tcp, 0.0.0.0:2182->2182/tcp,:::2182->2182/tcp, 2888/tcp, 3888/tcp
zoo3                /etc/confluent/docker/run        Up             2181/tcp, 0.0.0.0:2183->2183/tcp,:::2183->2183/tcp, 2888/tcp, 3888/tcp
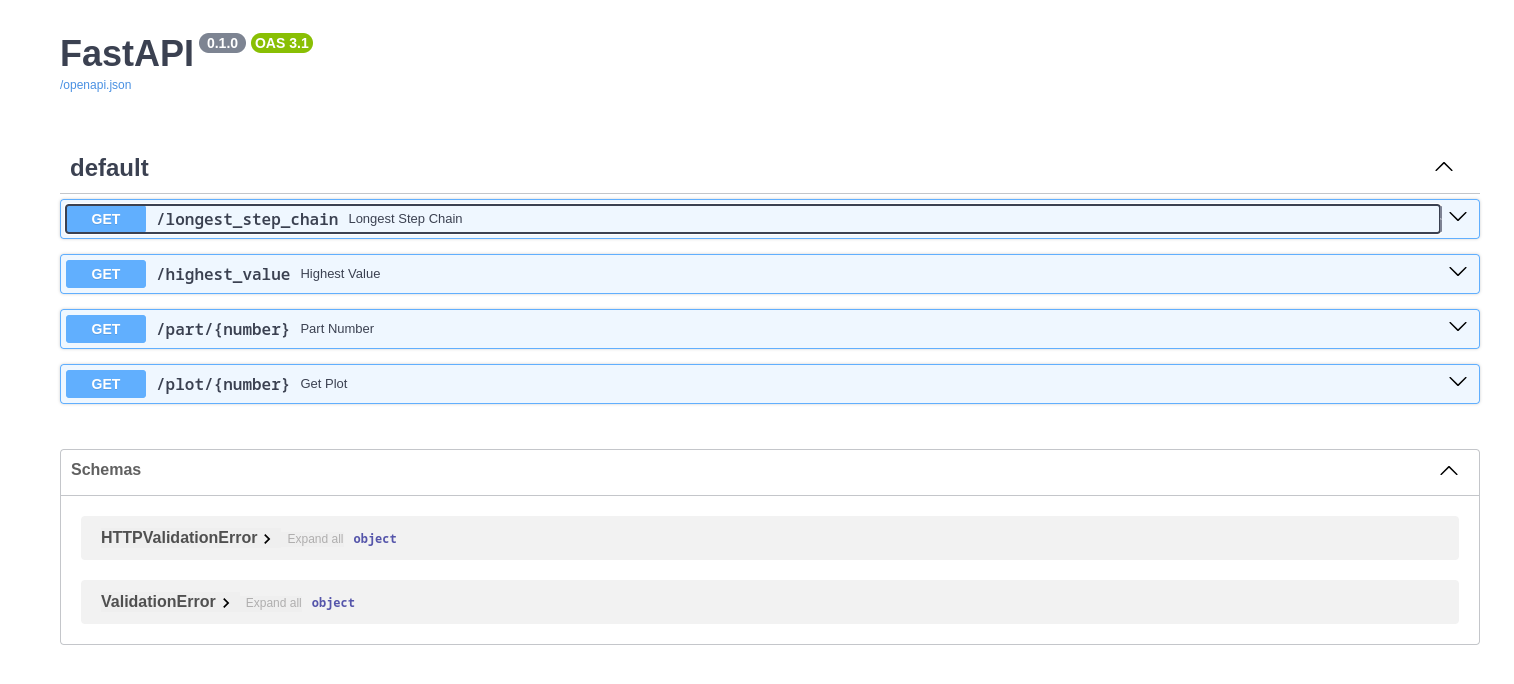
Now you can see swagger in expose port 8000.
In this example we can see swagger in this address http://127.0.0.1:8000/docs#/

Now we can see kafka cluster status in this address http://127.0.0.1:8080/ui

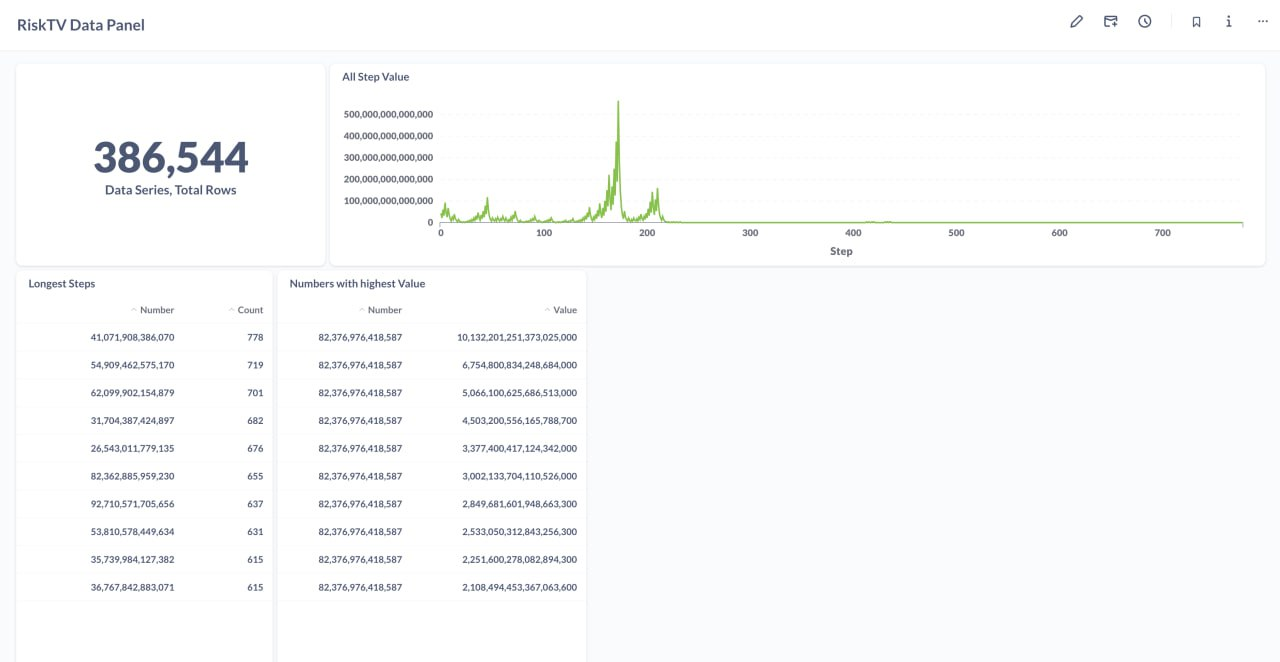
We Use metabase as Analytics Dashboard in this address http://127.0.0.1:3000

For answering question we can use both swagger or call raw API call
curl -X 'GET' \
  'http://172.16.40.40:8000/longest_step_chain' \
  -H 'accept: application/json'
The answer is:
{
  "longest": 31917434126612
}curl -X 'GET' \
'http://172.16.40.40:8000/highest_value' \
-H 'accept: application/json'The answer is:
{
  "longest": 77293533689575
}In this example x = 1024
curl -X 'GET' \
  'http://172.16.40.40:8000/part/1024' \
  -H 'accept: application/json'
The answer is:
[
  [
    2361437172277
  ],
  [
    29009624858921
  ],
  [
    35246528388678
  ],
  [
    44108625874832
  ],
  [
    55806168045825
  ],
  [
    58834351055852
  ],
  [
    67949987565981
  ],
  [
    76279233209058
  ],
  [
    76375094243638
  ]
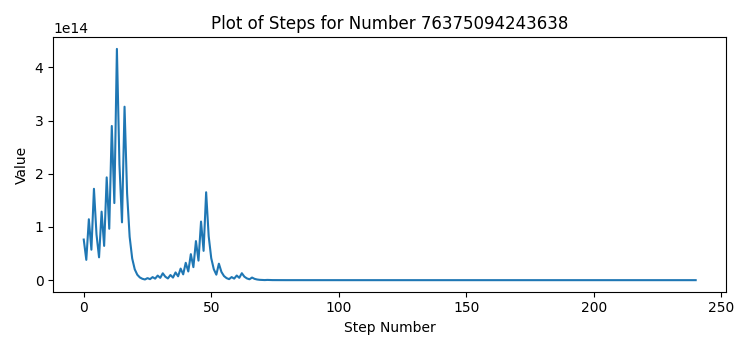
]curl -X 'GET' \
'http://172.16.40.40:8000/plot/76375094243638' \
-H 'accept: application/json'There is a dashboard in Metabase for above questions

For scale producer can use this command:
docker-compose up -d --scale producer=3For scale consumer can use this command:
docker-compose up -d --scale consumer=4and now can see the result in Kafka-UI

For creating new topic can use this command
docker exec kafka1 kafka-topics --create --topic alireza.test --bootstrap-server kafka1:9092For scale topic partition use this command
docker exec kafka1 kafka-topics --alter --topic alireza.test --bootstrap-server kafka1:9092 --partitions 40we have for Terraform files for setup cluster with Docker
- providers.tf for Providers than need to deploy
- images.tf for Docker Image resources
- containers.tf for Docker containers
- values.tf for Docker values
After build all images with build-all.sh script run this command to run cluster.
terraform init
terraform plan -out rikstv.tfplan
terraform applyI use a flat schema for storing data in clickhouse because MergeTree in clickhouse has great performance for aggregation queries
CREATE TABLE IF NOT EXISTS TABLE_NAME
(
        number UInt64,
        step UInt64,
        value UInt64,
        timestamp DateTime
)The minimum Server spec for run this stack is:
| Resource | Quantity |
|---|---|
| Process | 8 vCore |
| Memory | 12 GB |
| Storage | 50 GB |
Sequence diagram for producer is here:
temp: add vault, monitoring stack, log stack
pods in kube kafka in bare in ceph


