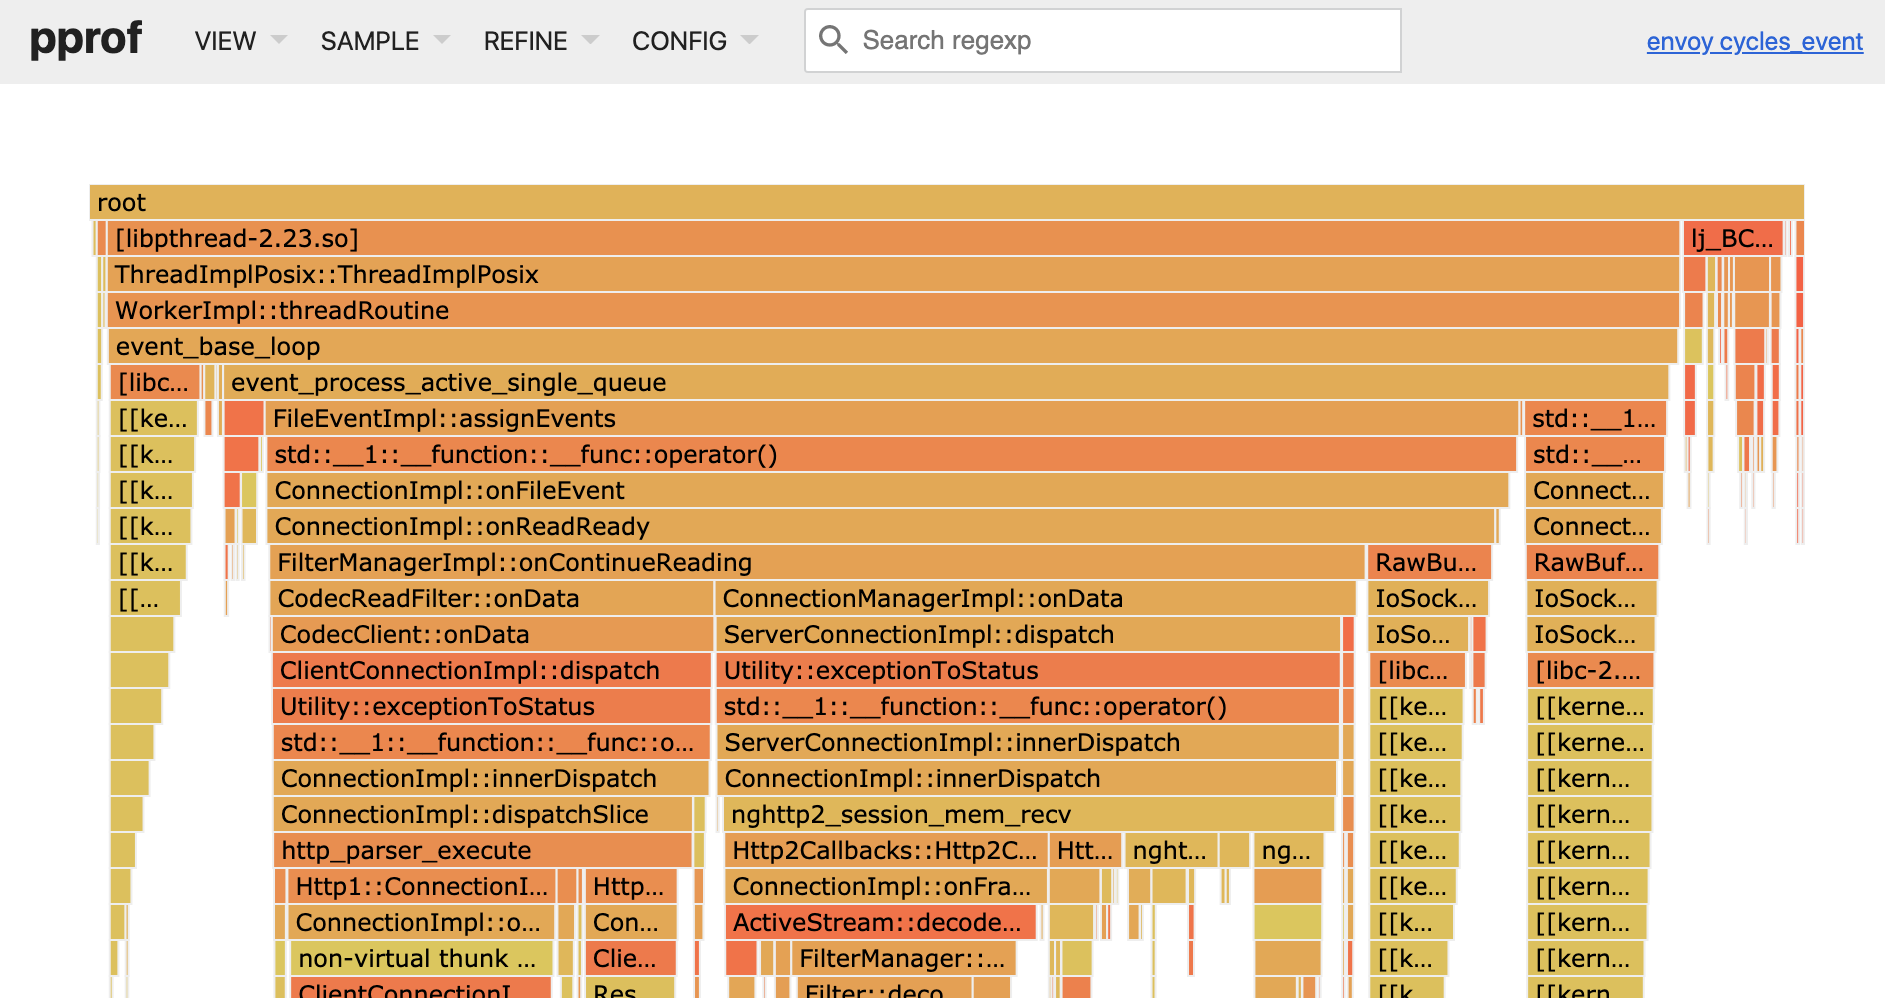
Convenient Envoy on-CPU performance analysis with perf and pprof.
envoy-perf-pprof takes perf data collected for an Envoy process and launches pprof for it.
Takes care of installing required dependencies in Docker and handling Envoy symbolization.
Call ./envoy-perf-pprof.sh v1.17.0 example/example.perf to play with an example profile.
Run perf on the machine running an official Envoy binary, e.g. a 10 minutes profile, as described
in Envoy docs:
$ perf record -F 49 -g -o /tmp/envoy.perf -p <envoy-pid> -- sleep 600
[ perf record: Woken up 1 times to write data ]
[ perf record: Captured and wrote 0.694 MB /tmp/envoy.perf (1532 samples) ]Execute ./envoy-perf-pprof.sh with profiled Envoy version and perf data file as arguments, e.g.:
$ ./envoy-perf-pprof.sh v1.17.0 envoy.perf
(...)
Serving web UI on http://0.0.0.0:8888
Open the link in the browser to access pprof web UI.
The first run will take a few of minutes as it builds the Docker image: installs dependencies and downloads proper Envoy version with debug symbols retained.
Instead of profiling with perf and envoy-perf-pprof you can compile Envoy with gperftools by yourself and use it instead of the official binaries.
This path is described in
Envoy docs.
It allows you to profile both CPU and memory.
