Major League Baseball teams embark on a relentless travel schedule, with each team journeying to 81 away games per season. This whirlwind of travel involves countless hours in planes and buses, a routine that would test anyone's endurance. Picture the familiar discomforts of long-haul travel: the cramped seats, the relentless drone of engines, the unavoidable physical and mental fatigue. These aren't just minor inconveniences; according to the National Library of Medicine, prolonged exposure to these travel conditions can significantly increase risks of insomnia, cardiovascular issues, and heightened stress, leading to more frequent emergency room visits.

Miles to Victory overall objective is to measure the correlation between travel distance and travel mode with a teams performance within a game, and determine if traveling affects the teams performance. We accomplished this in 5 steps:
- Calculated the distance between the host city and visiting team's city using coordinates & determine if the visiting team will use a bus or plane (if the trip is <250 miles, then the team will use a bus).
- Calculated the time each trip would take by dividing the distance by the transportation speed to get a travel time in hours.
- Cleaned the data set, only looking at games where the visiting team had actively travelled for.
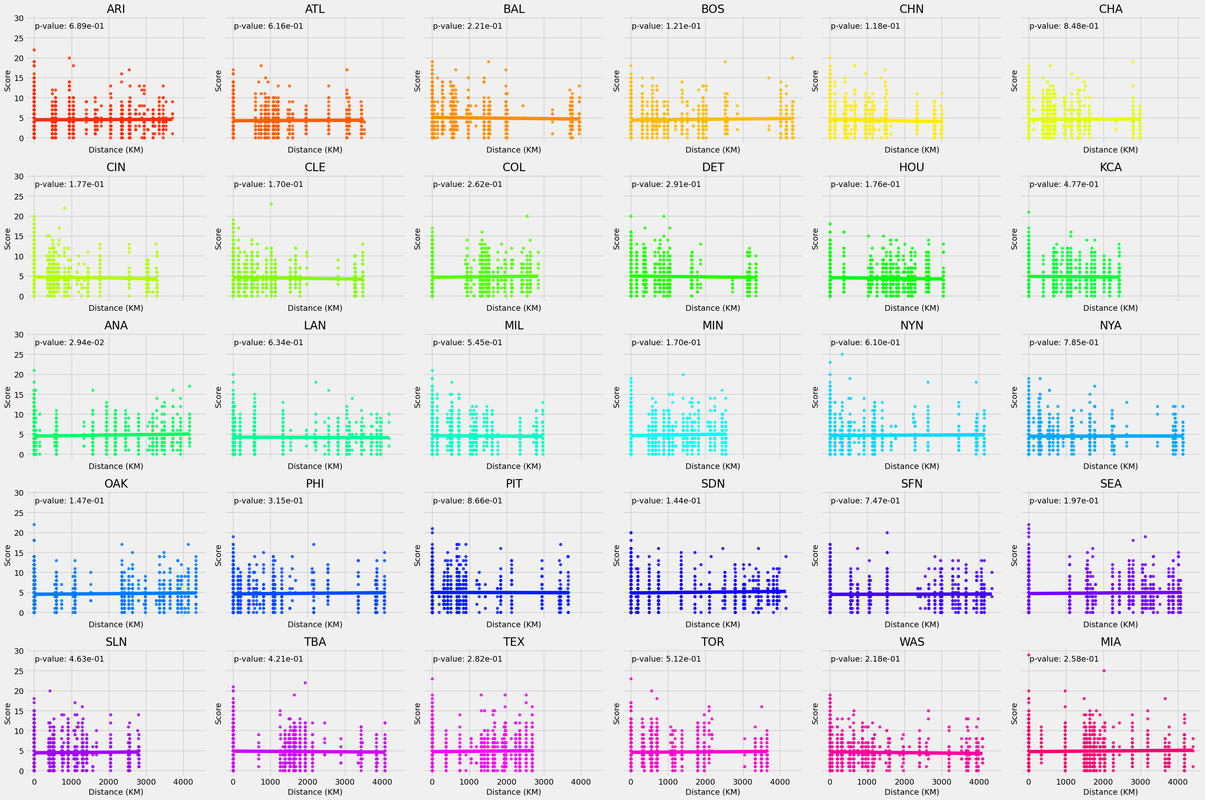
- Calculate an overall performance score for the visiting team, by adding up the positive features in the datasets such as game score, home runs, strikeouts, singles, doubles, and subtracting the negative features, such as pitcher walks and pitchers hit-by-pitches.
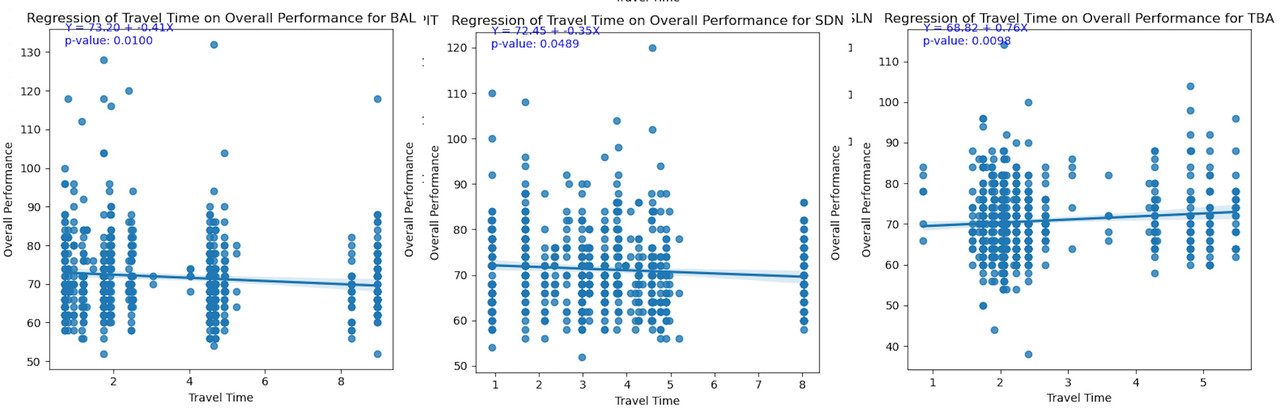
- Run a linear regression between overall performance score and distance distance traveled by visiting city.
- If distance travelled and the time traveled increase, then the away team's performance will decrease
We used Python, along with the standard data science libraries (pandas, numpy, scipy) to test our assumption. We used the GeoPy library along with the Opencage API to gather the coordinates for the cities and measure the distance between cities. We worked on Google Colab, which allowed us to work on the project together. The library MatplotLib was used for visualization of our results.
Research was key for us to fully understand this issue and how to approach the calculation of a teams performance. We used the MLB Glossary to understand all the terms in the data, and what their impact on the teams overall performance would be. We also used the MLB's Historical Timeline to understand some discrepancies in the data when a team changed names or locations. We used Sportscasting to learn the rules around what transportation modes MLB teams use when traveling. On the programming side, the Opencage API documentation was helpful for gathering city coordinates. The National Library of Medicine helped us understand the issue of repeated travel and made us interested in this project.
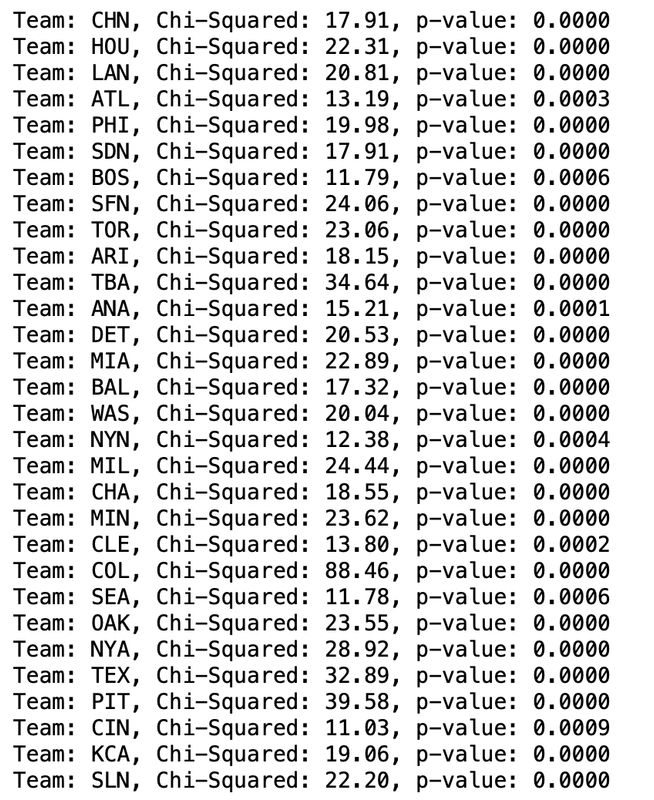
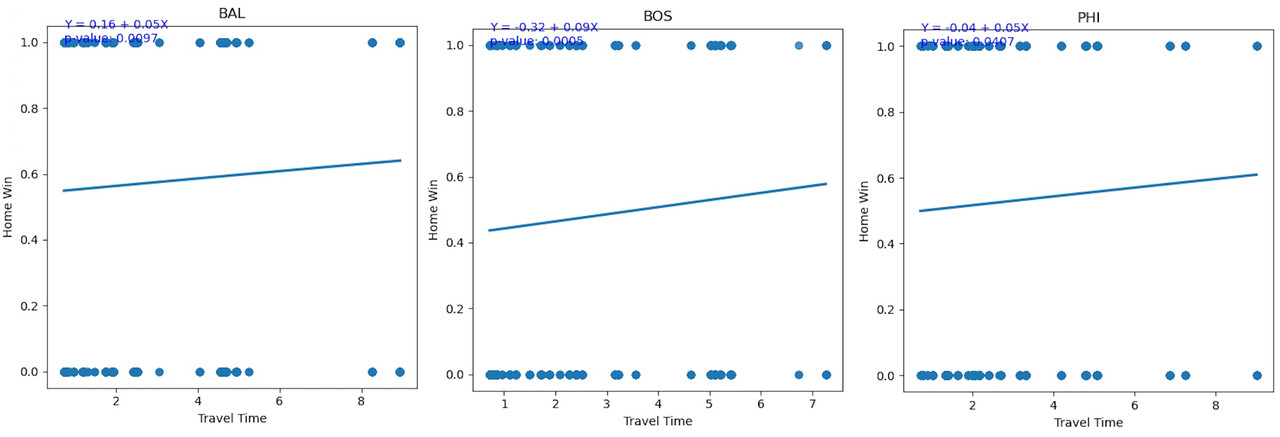
The results of this project are multi-faceted, but the overall conclusion we arrived at is that the distance and time travelled does not correlate to any change in performance for the away team. However, being an away team decidedly lowers the likelihood of winning the match, regardless of the kind of travel.
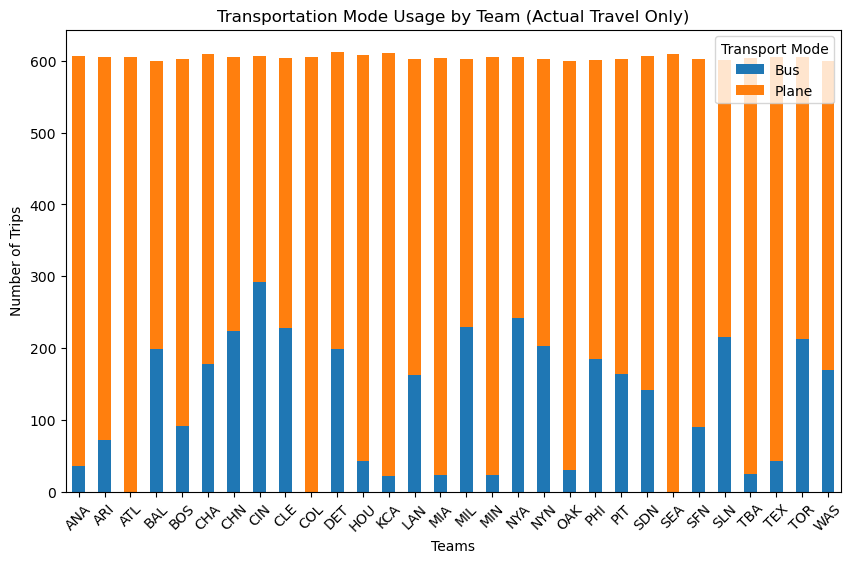
First, We looked at bus vs airplane usage by teams, and planes were decidedly more common than busses as transportation to an away game.
Note: We defined a significant correlation to have a p-value of >0.05
One challenge we ran into were the locations of a handful of games. Some games were held in different cities in different continents where there was no home team, which created some challenges when generating the coordinates. Another challenge we ran into was deciding on what we would consider when calculating the away team's performance and how each factor should be weighted. We also had some difficulty with feature engineering, deciding what independent variables to use. Some more general challenges included being unfamiliar with the baseball terms and learning how to use the Google Colab software.
We are proud of to have calculated the distance between every home and away team city accurately - we compared a few of our results with https://www.distancefromto.net/ and found a 99.8% accuracy. We are also happy with our feature engineering and feel that we accurately cleaned that data to run regressions on the correct games.
Overall we're proud to have learned about working with real-world data, learning to clean it, and drawing conclusions from real events that happened. We also learned a bit about baseball terminology, something we were all relatively unfamiliar with.
We would like to consider other independent variables that might affect the away team's performance, such as weather, which could be done by web scrapping the location and date. We would also like to further learn how to model a team's overall performance, and how to weigh the attributes that affect the performance accurately. And last but not least, we would like to add sort and filter options so other users can zoom into different sections of our results.
