SSE deamon is a small command-line tool that turns data received on it's standard input into server sent events. This makes it very easy to push data to browsers. What data to push and how to interpret it in the browser is up to you.
ssed requires node js and npm. To install ssed, run the following commands:
$>git clone https://github.com/benas/ssed.git
$>cd ssed
$>npm install
You can run ssed using node ssed.js or by making ssed.js executable:
$>chmod +x ssed.js
$>./ssed.js
You may want to add ssed to your PATH or make an alias for it: alias ssed='/path/to/ssed.js'
By default, ssed will start a server on port 3000. You can specify a different port as first parameter: node ssed.js 9000
The following command writes random numbers to the standard output every second.
These numbers can be piped out to ssed and rendered in a real time chart:
while sleep 1; do echo $[ ( $RANDOM % 100 ) + 1 ]; done | ssedRun this command and open the examples/random/index.html file in a browser. You should see a chart with live data:

On the client side, we need to listen to server sent events and update the chart:
var source = new EventSource("http://localhost:3000/");
source.onmessage = function(event) {
    updateChart(event.data);
};
As you can see, there is no need to create a server, just open the html file in a browser and you're done!
In the example above, replace echo $[ ( $RANDOM % 100 ) + 1 ] with cat /proc/meminfo | grep MemFree | awk '{print $2}' (or something similar using top or free commands) and you'll get a live chart of memory usage.
The following script (in examples/docker/docker-stats.sh) gathers some statistics about docker:
#!/bin/bash
IMAGES=$(docker images | wc -l);
RUNNING=$(docker ps --filter status=running | wc -l);
STOPPED=$(docker ps --filter status=exited | wc -l);
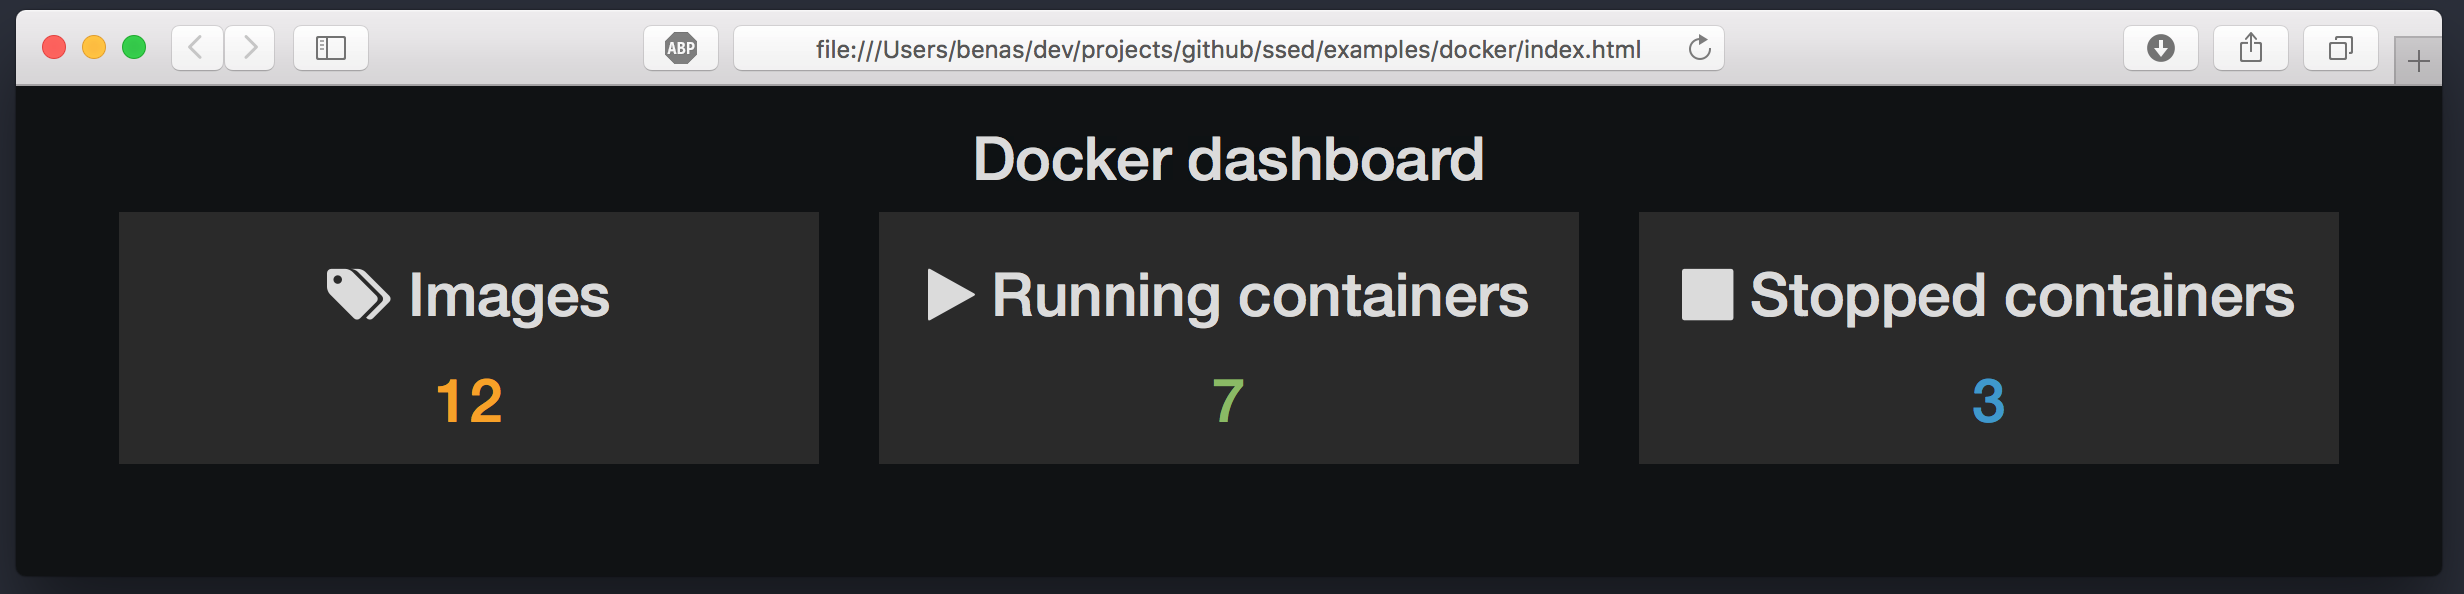
echo "{\"images\": \"$IMAGES\", \"running\": \"$RUNNING\", \"stopped\": \"$STOPPED\"}";Stats are written to the standard output in JSON format. Let's pipe them out to ssed:
while sleep 10; do docker-stats.sh ; done | ssedWe can now consume these stats in a web page:
var source = new EventSource("http://localhost:3000/");
source.onmessage = function(event) {
    var data = JSON.parse(event.data);
    $('.images').text( data.images );
    $('.running').text( data.running );
    $('.stopped').text( data.stopped );
};
This snippet from examples/docker/index.html will parse data and show it in the following dashboard:
This example is the same idea as docker dashboard, but for git.
The following script (in examples/git/git-stats.sh) gathers statistics from a git repository:
#!/bin/bash

FOLDER=$1
cd ${FOLDER}

BRANCHES=$(git branch -a | wc -l);
TAGS=$(git tag -l | wc -l);
REVERTS=$(git log --oneline | grep 'revert' | wc -l);

echo "{\"branches\": \"$BRANCHES\", \"tags\": \"$TAGS\", \"reverts\": \"$REVERTS\"}";
Stats are written to the standard output in JSON format and piped out to ssed:
while sleep 5; do git-stats.sh /Users/benas/dev/projects/github/ssed/; done | ssedReporting data is then consumed in a web page:
var source = new EventSource("http://localhost:3000/");
source.onmessage = function(event) {
    var data = JSON.parse(event.data);
    $('.branches').text( data.branches );
    $('.tags').text( data.tags );
    $('.reverts').text( data.reverts );
};
This snippet from examples/git/index.html will parse data and show it in the following dashboard:

These stats are probably not relevant and used here just for demonstration purpose. But we can imagine a dashboard for a team with:
- current features and bug-fixes branches (based on name pattern)
- who is working on each branch
- a live chart with git activities (last commits, branch creation/deletion, ..)
- etc
The following command will push server logs to the browser:
tail -f server.log | ssedCool! we've just implemented logio 😄
Try to run this command on a changing file in your system and open the examples/log/index.html file in a browser.
You should see log events added in real time to the web page.
Now that you've got the idea, time to get your hands dirty! We can imagine any program that collects data on a regular interval,
write it to the standard output and pipe it out to ssed. Here are some ideas:
- display live Linux system stats (memory, CPU, IO, etc) in a pretty dashboard, just like web-vmstats
- track data from a database: running for example
mysql -e 'SELECT COUNT(*) FROM orders'every few minutes and make a live dashboard of it - monitor Docker using docker stats
- monitor ElasticSearch using node stats
- monitor MongoDB server using mongo stats
- etc
Your imagination is the limit!
You are welcome to contribute to the project with pull request on github. I'm really bad at web design! All I know is importing twitter bootstrap css and js files in a html file. If you can contribute an example of dashboard with cool widgets, I'll really appreciate your help! Many thanks upfront.
ssedis inspired by websocketdsseduses sse-node module to push server sent events to browsers.- The random numbers example above uses smoothie charts to render the live chart.
ssed is released under the .
The MIT License (MIT)

Copyright (c) 2016 Mahmoud Ben Hassine (mahmoud.benhassine@icloud.com)

Permission is hereby granted, free of charge, to any person obtaining a copy
of this software and associated documentation files (the "Software"), to deal
in the Software without restriction, including without limitation the rights
to use, copy, modify, merge, publish, distribute, sublicense, and/or sell
copies of the Software, and to permit persons to whom the Software is
furnished to do so, subject to the following conditions:

The above copyright notice and this permission notice shall be included in
all copies or substantial portions of the Software.

THE SOFTWARE IS PROVIDED "AS IS", WITHOUT WARRANTY OF ANY KIND, EXPRESS OR
IMPLIED, INCLUDING BUT NOT LIMITED TO THE WARRANTIES OF MERCHANTABILITY,
FITNESS FOR A PARTICULAR PURPOSE AND NONINFRINGEMENT. IN NO EVENT SHALL THE
AUTHORS OR COPYRIGHT HOLDERS BE LIABLE FOR ANY CLAIM, DAMAGES OR OTHER
LIABILITY, WHETHER IN AN ACTION OF CONTRACT, TORT OR OTHERWISE, ARISING FROM,
OUT OF OR IN CONNECTION WITH THE SOFTWARE OR THE USE OR OTHER DEALINGS IN
THE SOFTWARE.