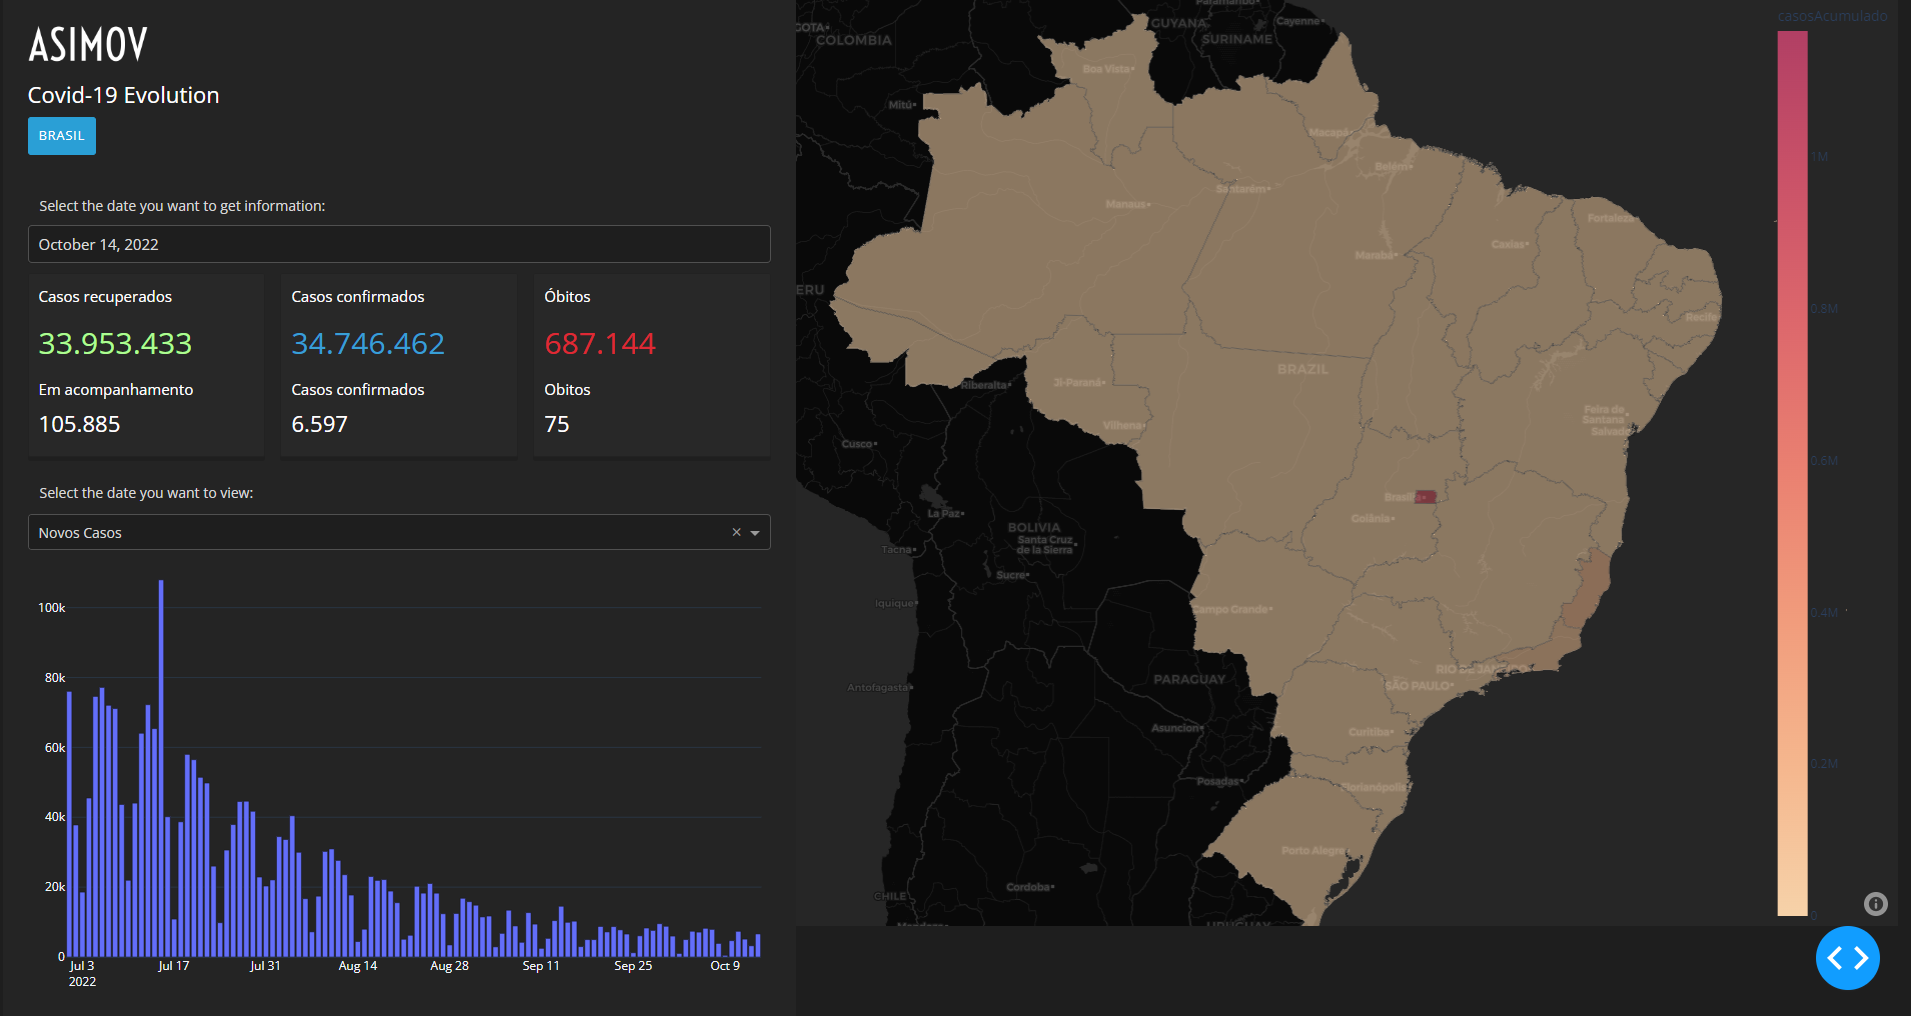
Dashboard developed to study Plotly Dash. The dashboard track the Covid-19 evolution on Brazil.
Thanks to Asimov
Antes de começar, verifique se você atendeu aos seguintes requisitos:
Python 3Pipenv
- Clone this project to your computer
- Run
pipenv install
- Run
pipenv run python src/app.py - Open on browser the server address (default [http://127.0.0.1:8050])
|
Emanuel Almeida |
This project is on license. See the License to more info.


