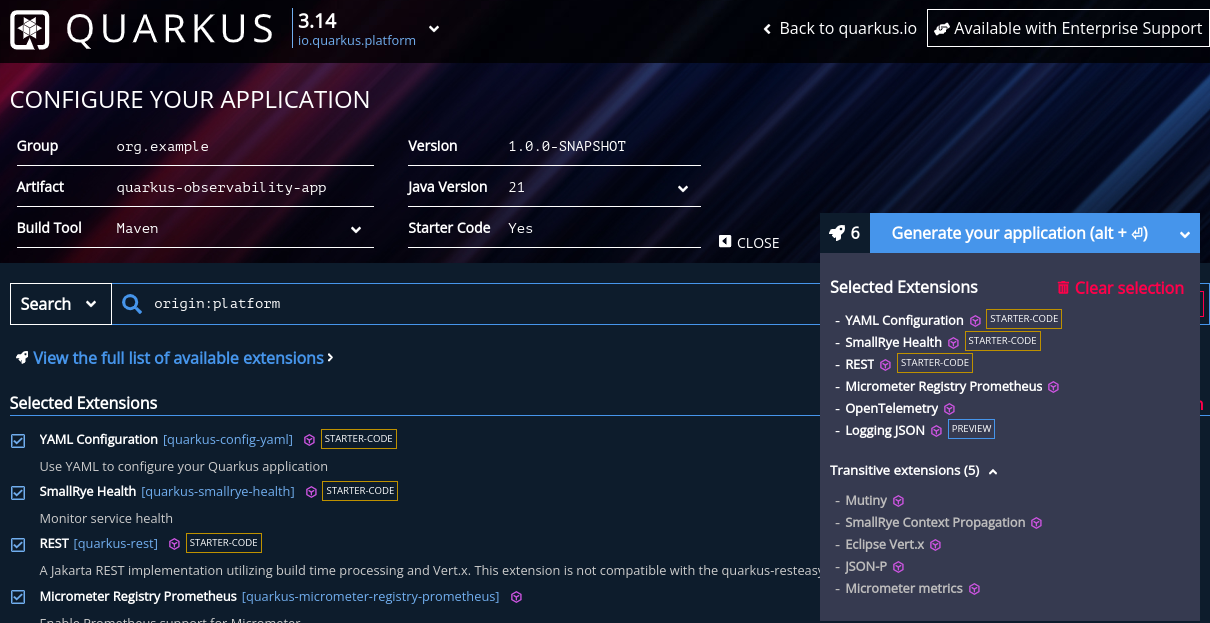
This application was created to showcase how to configure Logging, Metrics, and Tracing in a Quarkus and collect and manage them using the supported infrastructure of Openshift.
The application was built using Quarkus, a Container-First framework for writing Java applications.
| Extension Name | Purpose |
|---|---|
Expose Metrics |
|
Format Logs in JSON |
|
Distributed Tracing |
|
Live and Running endpoints |
In order to collect the logs, metrics, and traces from our application, we are going to deploy and configure several Openshift components. The installation and configuration of the components are not the focus of this repository, so I will provide links to my other repositories where I have my quickstarts for those components.
| Openshift Component | Purpose |
|---|---|
Collect and display distributed traces. Now, in version 3.0, it is based on the Grafana Tempo project. The 2.x releases were based on Jaeger. Both projects use the OpenTelemetry standard. |
|
Collect metrics in OpenMetrics format from user workloads and present it in the built-in dashboard. It also allows the creation of alerts based on metrics. |
|
Collect, store, and visualize logs from workloads. |
Access the Code Quarkus site that will help you to generate the application quickstart with the Quarkus extensions:
Generate the application and download it as .zip.
The application is similar to the autogenerated version, but with the following customizations:
-
I’ve added a new endpoint to count something using the Swagger OpenApi library.
-
I’ve used the Micrometer metrics library to generate custom metrics that I will expose in the Prometheus endpoint. I’ve created three new metrics:
-
Gauges measure a value that can increase or decrease over time, like the speedometer on a car.
-
Counters are used to measure values that only increase.
-
Distribution summaries record an observed value, which will be aggregated with other recorded values and stored as a sum
-
You can run your application in dev mode that enables live coding using:
mvn compile quarkus:devNOTE: Quarkus now ships with a Dev UI, which is available in dev mode only at http://localhost:8080/q/dev/.
The application can be packaged using:
mvn packageIt produces the quarkus-run.jar file in the target/quarkus-app/ directory. Be aware that it’s not an uber-jar as the dependencies are copied into the target/quarkus-app/lib/ directory.
The application is now runnable using java -jar target/quarkus-app/quarkus-run.jar.
If you want to build an uber-jar, execute the following command:
mvn package -Dquarkus.package.type=uber-jarThe application, packaged as an uber-jar, is now runnable using java -jar target/*-runner.jar.
Manual steps to generate the container image locally:
# Generate the Native executable
mvn package -Pnative -Dquarkus.native.container-runtime=podman -Dquarkus.native.remote-container-build=true -Dquarkus.container-image.build=true

# Add the executable to a container image
podman build -f src/main/docker/Dockerfile.native -t quarkus/quarkus-observability-app .

# Launch the application
podman run -i --rm -p 8080:8080 quarkus/quarkus-observability-appDeploy the app in a new namespace using the following command:
# Create the project
oc process -f openshift/quarkus-app/10-project.yaml | oc apply -f -


# Create a ConfigMap to mount in the application to configure without rebuilding
oc create configmap app-config --from-file=application.yml=src/main/resources/application-ocp.yml -n quarkus-observability

# Install the application
oc process -f openshift/quarkus-app/20-app.yaml | oc apply -f -

# After that, you can access the Swagger UI using the following link
oc get route app -n quarkus-observability --template='https://{{ .spec.host }}/q/swagger-ui'Red Hat build of OpenTelemetry product provides support for deploying and managing the OpenTelemetry Collector and simplifying the workload instrumentation. It can receive, process, and forward telemetry data in multiple formats, making it the ideal component for telemetry processing and interoperability between telemetry systems.
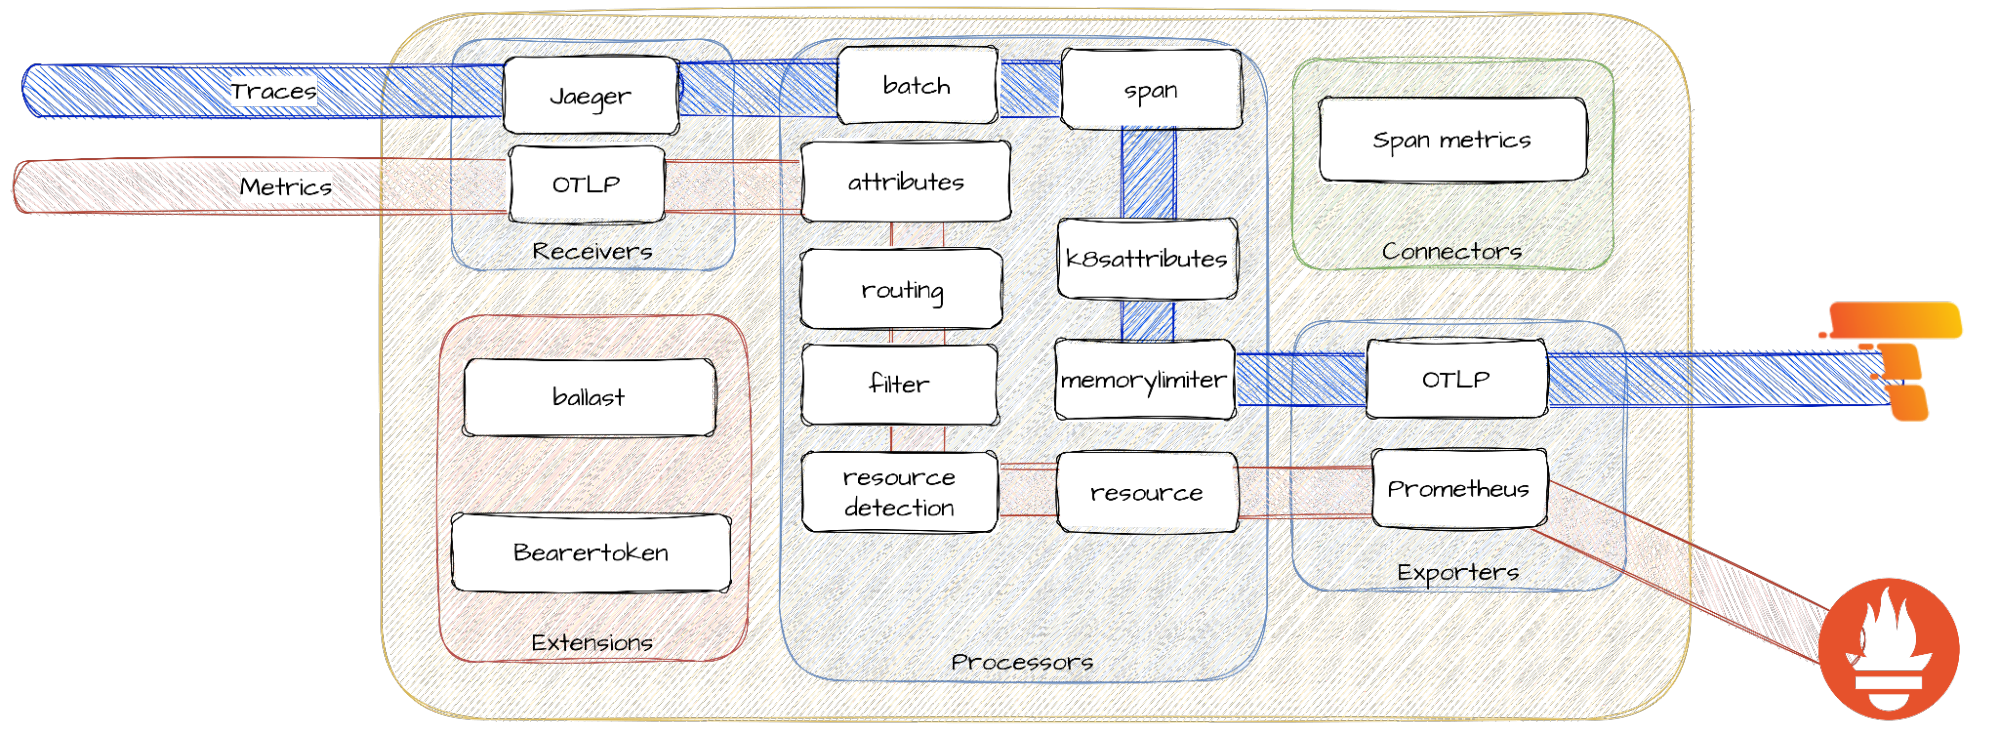
OpenTelemetry is made of several components that interconnect to process metrics and traces. The following diagram from this blog will help you to understand the architecture:
For more context about OpenTelemetry, I strongly recommend reading the following blogs:
|
ℹ️
|
If you struggle with OTEL configuration, please check this redhat-rhosdt-samples repository. |
# Install the operator
oc apply -f openshift/ocp-opentelemetry/10-subscription.yamlRed Hat OpenShift Distributed Tracing lets you perform distributed tracing, which records the path of a request through various microservices that make up an application.
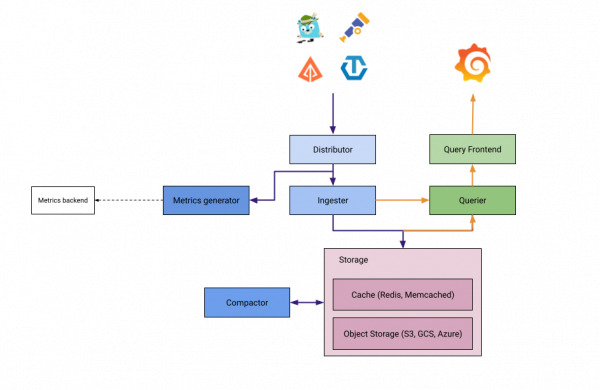
Tempo is split into several components deployed as different microservices. From a beginner’s point of view, it can be more complex to understand. The following diagram from this blog will help you to better understand the architecture:
For more context about DistTracing, I strongly recommend reading the following blogs:
For more information, check the official documentation.
# Create an s3 bucket
./openshift/ocp-distributed-tracing/tempo/aws-create-bucket.sh ./aws-env-vars

# Install the operator
oc apply -f openshift/ocp-distributed-tracing/tempo/10-subscription.yaml

# Deploy Tempo
oc process -f openshift/ocp-distributed-tracing/tempo/20-tempostack.yaml | oc apply -f -
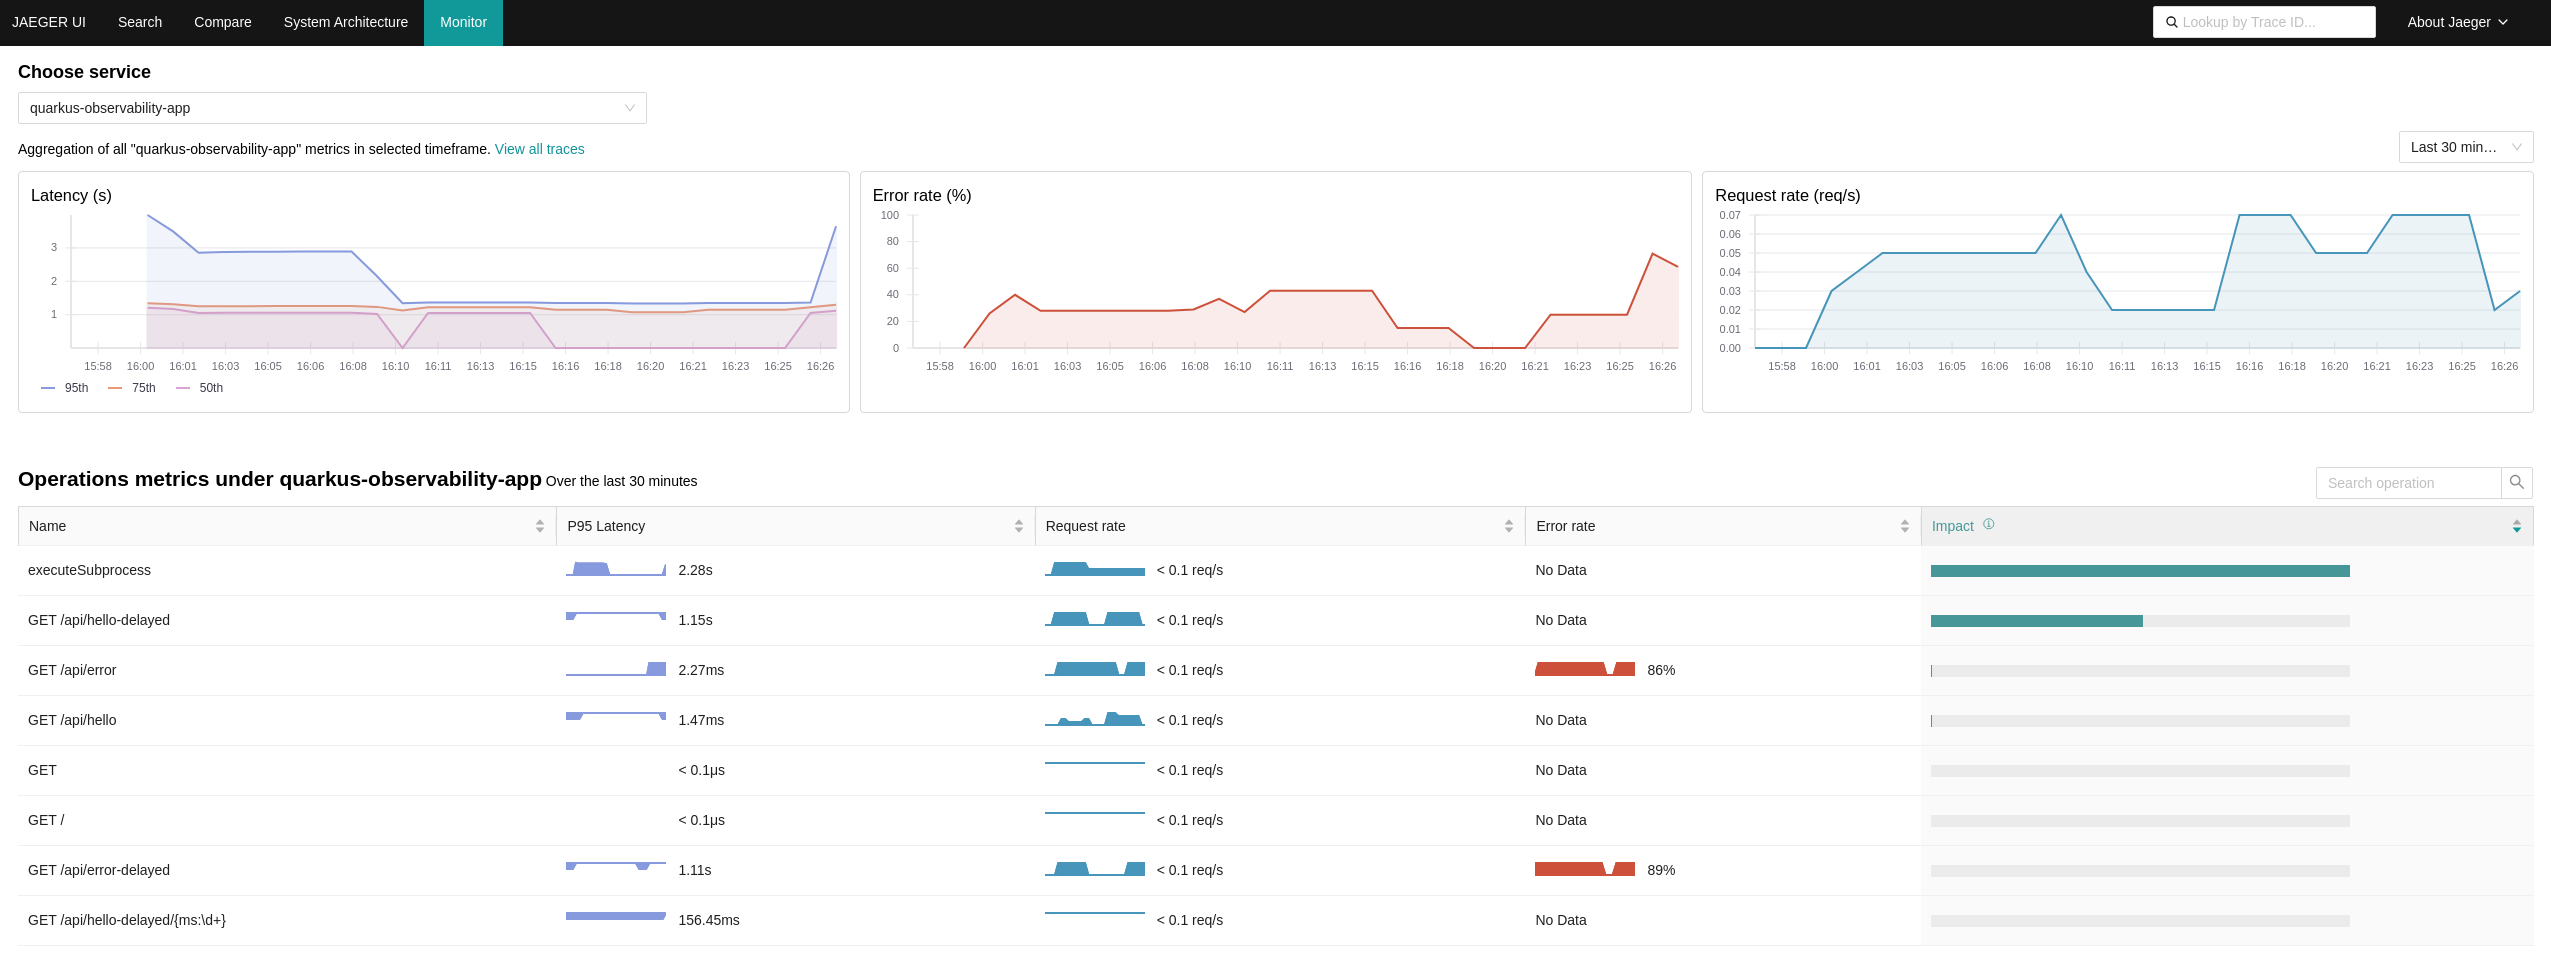
Once you have configured everything, you can access the Metrics tab and show stats retrieved directly from the Traces collected by the OpenTelemetry collector. This is an example of the output:
By default, the Grafana Tempo operator does not configure or provide any Grafana Dashboards for monitoring. Therefore, I have collected the ones provided upstream in this folder: https://github.com/grafana/tempo/tree/main/operations/tempo-mixin-compiled.
In OpenShift Container Platform 4.14, you can enable monitoring for user-defined projects in addition to the default platform monitoring. You can monitor your own projects in OpenShift Container Platform without the need for an additional monitoring solution.
# Enable user workload monitoring
oc apply -f openshift/ocp-monitoring/10-cm-cluster-monitoring-config.yaml

# Configure the user workload monitoring instance
oc apply -f openshift/ocp-monitoring/11-cm-user-workload-monitoring-config.yaml

# Add Service Monitor to collect metrics from the App
oc process -f openshift/ocp-monitoring/20-service-monitor.yaml | oc apply -f -
For more information, check the official documentation.
|
ℹ️
|
If you face issues creating and configuring the Service monitor, you can use this Thoubleshooting guide. |
Using Openshift Metrics, it is really simple to add alerts based on those Prometheus Metrics:
# Add Alert to monitorize requests to the API
oc process -f openshift/ocp-alerting/10-prometheus-rule.yaml | oc apply -f -# Install the Grafana Operator
oc process -f openshift/grafana/10-operator.yaml | oc apply -f -
# Deploy a Grafana Instance
oc process -f openshift/grafana/20-instance.yaml | oc apply -f -
# Create Datasource
oc process -f openshift/grafana/30-datasource.yaml \
-p BEARER_TOKEN=$(oc get secret $(oc describe sa grafana-sa -n grafana | awk '/Tokens/{ print $2 }') -n grafana --template='{{ .data.token | base64decode }}') \
| oc apply -f -
# Configure Grafana Dashboard for the quarkus-observability-app
oc process -f openshift/grafana/40-dashboard.yaml \
-p DASHBOARD_GZIP="$(cat openshift/grafana/quarkus-observability-dashboard.json | gzip | base64 -w0)" \
-p DASHBOARD_NAME=quarkus-observability-dashboard \
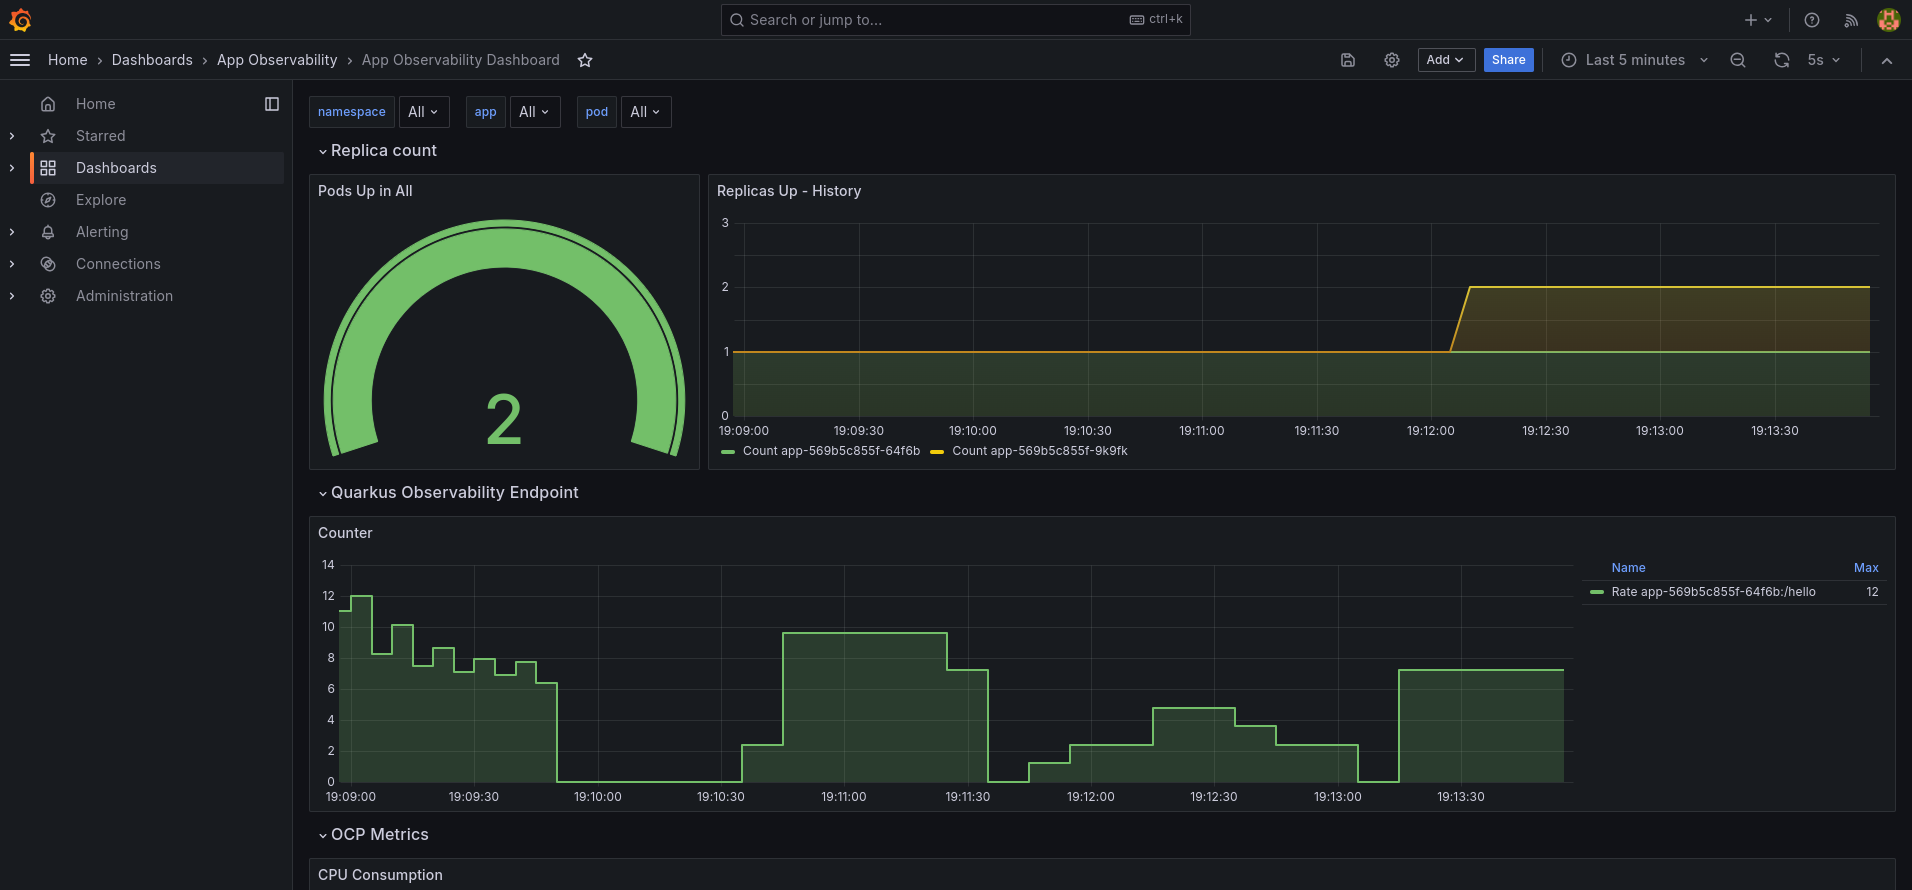
-p CUSTOM_FOLDER_NAME="Quarkus Observability" | oc apply -f -After installing, you can access the Grafana UI and see the following dashboard:
The logging subsystem aggregates infrastructure and applications logs from throughout your cluster and stores them in a default log store. The Openshift Logging installation section consists of sections:
-
Installation of the Openshift logging operator. Always needed.
-
Installation of the Loki operator as the logging backend. This is mutually exclusive with section 2).
-
Installation of the ElasticSearch operator as the logging backend. This is mutually exclusive with section 3).
oc apply -f openshift/ocp-logging/00-subscription.yamlCurrently, the Openshift Logging team decided to move from EFK to Vector+Loki. The original Openshift Logging Stack was split into three products: ElasticSearch ( Log Store and Search), Fluentd (Collection and Transportation), and Kibana (Visualization). Now, there will be only two: Vector (Collection) and Loki (Store).
In order to keep up to date and age better, this repo explores both implementations.
# Install the Loki operator
oc apply -f openshift/ocp-logging/loki/10-operator.yaml

# Create an AWS S3 Bucket to store the logs
./openshift/ocp-logging/loki/aws-create-bucket.sh ./aws-env-vars

# Create the Logging instance
oc process -f openshift/ocp-logging/loki/20-instance.yaml \
    --param-file aws-env-vars --ignore-unknown-parameters=true | oc apply -f -

# Enable the console plugin
# -> This plugin adds the logging view into the 'observe' menu in the OpenShift console. It requires OpenShift 4.10.
oc patch console.operator cluster --type json -p '[{"op": "add", "path": "/spec/plugins", "value": ["logging-view-plugin"]}]'|
|
As of logging version 5.4.3 the OpenShift Elasticsearch Operator is deprecated and is planned to be removed in a future release. As of logging version 5.6 Fluentd is deprecated and is planned to be removed in a future release. |
# Install the Elastic operator
oc apply -f openshift/ocp-logging/elasticsearch/10-operator.yaml

# Create the Logging instance
oc apply -f openshift/ocp-logging/elasticsearch/20-instance.yaml
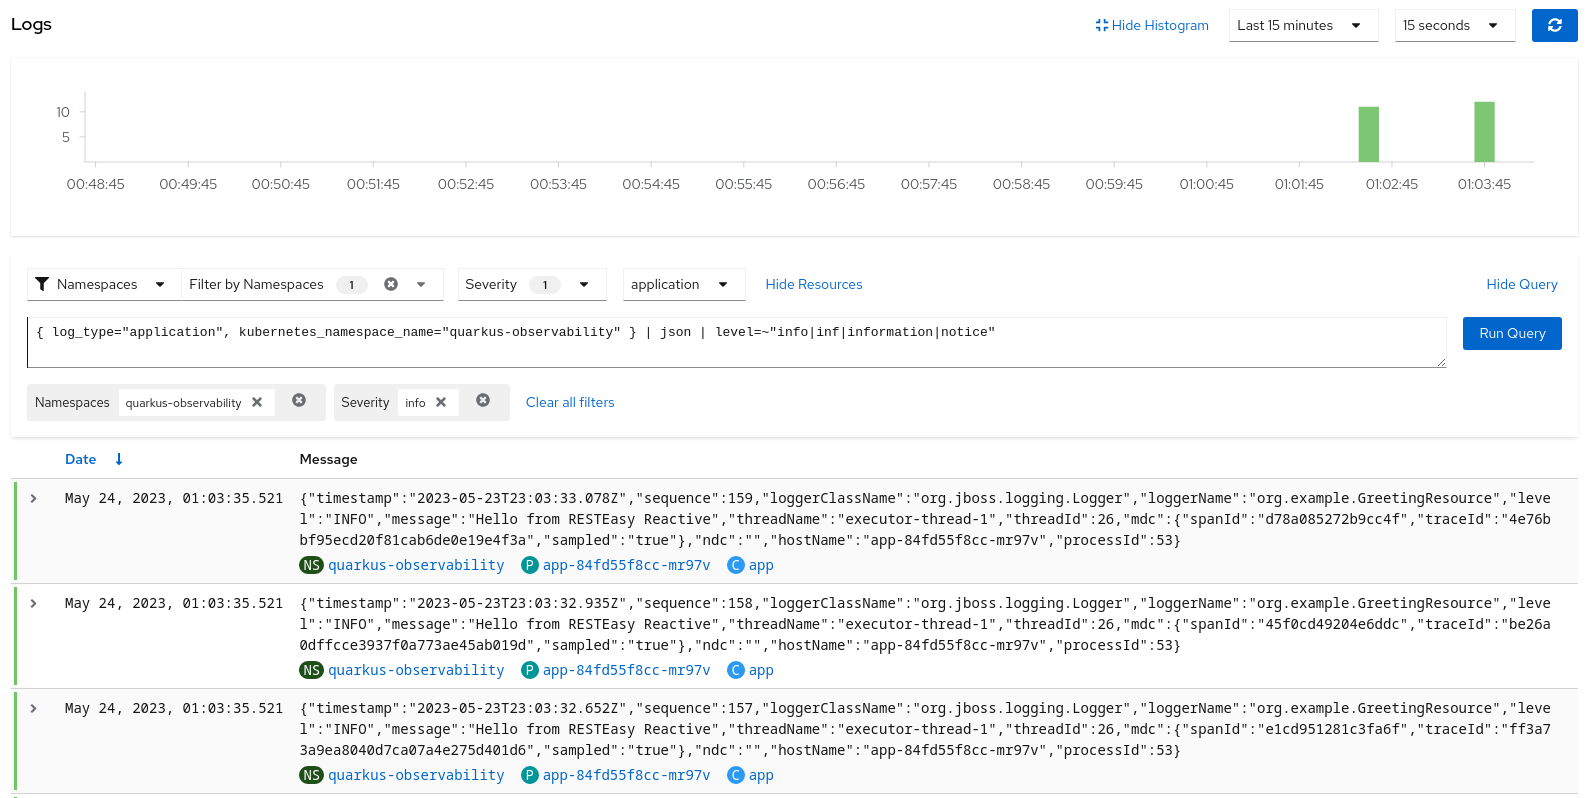
After installing and configuring the indexing pattern, you will be able to perform queries for the logs:
By default, the logging subsystem sends container and infrastructure logs to the default internal log store (That we created in options 1 and 2).
oc get Infrastructure/cluster -ojson | jq .status.infrastructureNameoc process -f openshift/ocp-logging/log-forwarding/cluster-log-forwarder-aws.yaml \
--param-file aws-env-vars --ignore-unknown-parameters=true \
-p CLOUDWATCH_GROUP_PREFIX=$(oc get Infrastructure/cluster -o=jsonpath='{.status.infrastructureName}') \
| oc apply -f -Now, you can check the logs in Cloudwatch using the following command:
source aws-env-vars
aws --output json logs describe-log-groups --region=$AWS_DEFAULT_REGIONAs you may already know, you can define network policies that restrict traffic to pods in your cluster. When the cluster is empty and your applications don’t rely on other Openshift components, this is easy to configure. However, when you add the full observability stack plus extra common services, it can get tricky. That’s why I would like to summarize some of the common NetworkPolicies:
# Here you will deny all traffic except for Routes, Metrics, and webhook requests.
oc process -f openshift/ocp-network-policies/10-basic-network-policies.yaml | oc apply -f -
For other NetworkPolicy configurations, check the official documentation.
Pipelines as code allow to define CI/CD in a file located in git. This file is then used to automatically create a pipeline for a Pull Request or a Push to a branch.
This step automates all the steps in this section of the documentation:
-
Create an application in GitHub with the configuration of the cluster.
-
Create a secret in Openshift with the configuration of the GH App
pipelines-as-code-secret.
tkn pac bootstrap
# In the interactive menu, set the application name to `pipelines-as-code-app`It is possible to use Labels to set the automatic expiration of individual image tags in Quay. In order to test that, I just added a new dockerfile that takes an image as a build argument and labels it with a set expiration time.
podman build -f src/main/docker/Dockerfile.add-expiration \
    --build-arg IMAGE_NAME=quay.io/alopezme/quarkus-observability-app \
    --build-arg IMAGE_TAG=latest-micro \
    --build-arg EXPIRATION_TIME=2h \
-t quay.io/alopezme/quarkus-observability-app:expiration-test .# Nothing related to expiration:
podman inspect image --format='{{json .Config.Labels}}' quay.io/alopezme/quarkus-observability-app:latest-micro | jq
# Adds expiration label:
podman inspect image --format='{{json .Config.Labels}}' quay.io/alopezme/quarkus-observability-app:expiration-test | jq