This repository stores Jupyter Notebooks to demonstrate skills in Data Science, Artificial Intelligence, classification and regression problems with Python, Keras, scikit-learn, Matplotlib, NumPy, Pandas, TPOT, XGBoost, Folium, Seaborn among others.
The code has been tested using:
- Python (3.10): an interpreted high-level programming language for general-purpose programming.
- Jupyter Lab (4.2): a web-based interactive development environment for Jupyter Notebooks, code, and data.
- Keras (TensorFlow built-in): a high-level neural networks API, written in Python and capable of running on top of TensorFlow, CNTK, or Theano.
- TensorFlow (2.17): an open source Deep Learning library for high performance numerical computation using data flow graphs.
- Matplotlib (3.9): a plotting library for Python and its numerical mathematics extension NumPy.
- NumPy (1.26): a library for Python, adding support for large, multi-dimensional arrays and matrices, along with a large collection of high-level mathematical functions to operate on these arrays.
- Pandas (2.2): an open source library providing high-performance, easy-to-use data structures and data analysis tools for Python.
- scikit-learn (1.5): a machine learning library for Python. It features various classification, regression and clustering algorithms including support vector machines, random forest, gradient boosting, k-means and DBSCAN.
- scikit-image (0.24): a collection of algorithms for image processing with Python.
- TPOT (0.12): a Python Automated Machine Learning tool that optimizes machine learning pipelines using genetic programming.
- XGBoost (2.1): an optimized distributed gradient boosting library designed to be highly efficient, flexible and portable.
- Folium (0.17): an open source library to visualize data that has been manipulated in Python on an interactive Leaflet.js map.
- ipyleaflet (0.19): a Jupyter / Leaflet.js bridge enabling interactive maps in Jupyter Notebook.
- Seaborn (0.13): a Python visualization library based on Matplotlib. It provides a high-level interface for drawing attractive statistical graphics.
- imbalanced-learn (0.12): a Python package offering a number of re-sampling techniques commonly used in datasets showing strong between-class imbalance. It is compatible with scikit-learn and it allows SMOTE (Synthetic Minority Over-sampling Technique).
- joblib (1.4): a set of tools to provide lightweight pipelining in Python.
- findspark (2.0): a package to make Spark Context available in Jupyter Notebook.
Virtual environment (<env_name>=.venv) can be generated with requirements.txt file found in main folder.
Command to configure virtual environment with venv:
~/datascience$ python3 -m venv .venv
~/datascience$ source .venv/bin/activate
(.venv)~/datascience$ python3 -m pip install pip==24.2
(.venv)~/datascience$ python3 -m pip install setuptools==75.2.0
(.venv)~/datascience$ python3 -m pip install -r requirements.txt
(.venv)~/datascience$ pre-commit installA good way to play with the Jupyter Notebooks is through Jupyter Lab. To run any of them use the command shown below:
(.venv)~/datascience$ jupyter lab <notebook_name>.ipynbIt might be also necessary to install locally Graphviz for rendering graph images with the command:
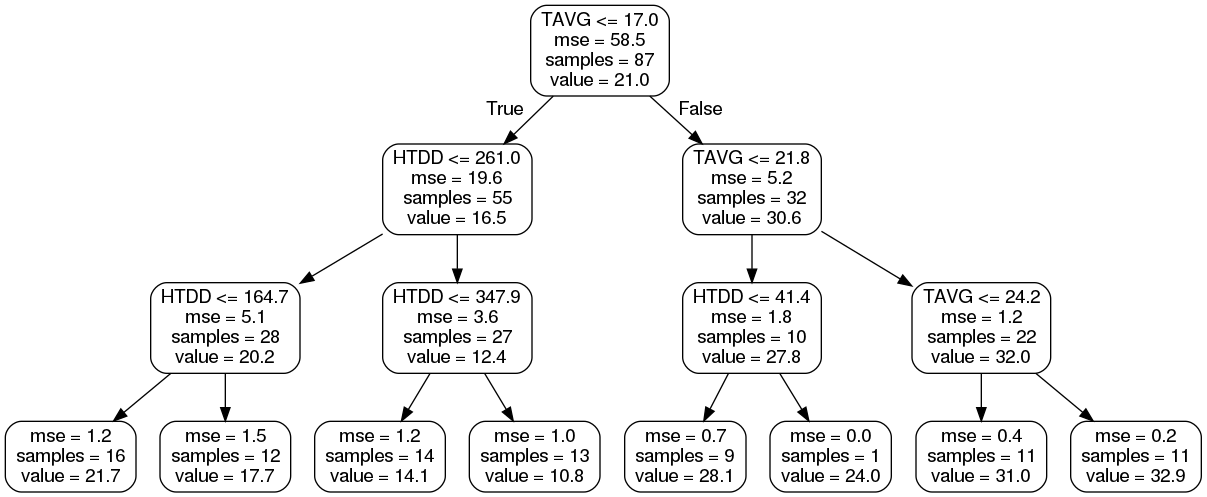
~/datascience$ sudo apt-get install graphvizGraph image example of a decision tree is shown below.
author: alvertogit copyright: 2018-2024
