This is an on-going project that is not finished. We are actively working on it and anticipate finishing the project in early 2022.
We created a sample of financial time-series images (candlestick charts and line graphs) and developed a machine learning image classification algorithm to identify previously labeled technical indicators (e.g., RSI). This project is an open-source, approximate replication of
Naftali Cohen, Tucker Balch, & Manuela Veloso. Trading via Image Classification. arXiv preprint arXiv:1907.10046, 2019.
-
We retrieved the daily open, high, low, and close data on 505 firms listed in the S&P500 (see list_of_SP_500.csv in the data folder). The data ranges from 01 January 2011 to 01 January 2019. The data was retrieved from Alpaca.
-
We calculated three technical indicators: moving average convergence/divergence (MACD), relative strength index (RSI), and Bollinger Bands (BB). Each technical indicator resulted in a buy or no-buy signal for each trading day. However, we had too few buy signals for the relative strength index, so we did not consider it further.
-
For each technical indicator, we randomly sampled 20 buy and 20 no-buy signals for each ticker in the S&P 500.
-
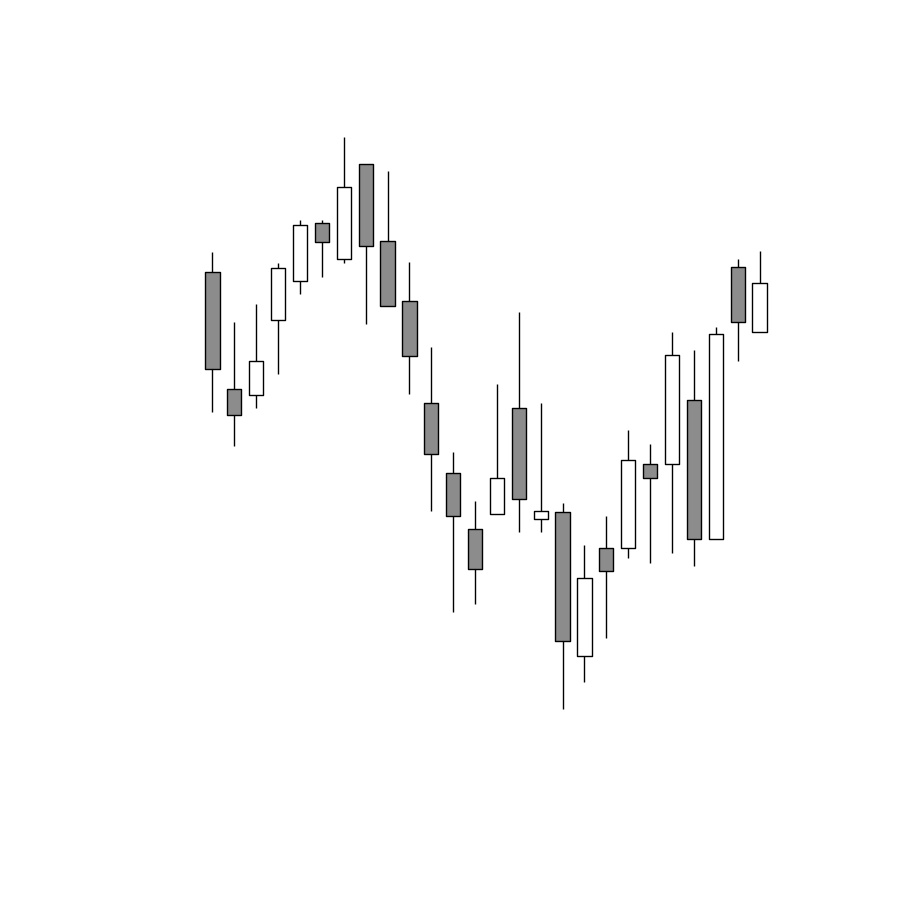
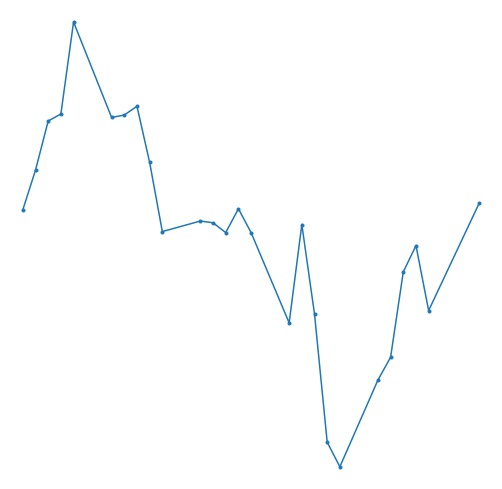
We created a line plot and candle stick plot for each of the randomly sampled signals. Here are some example plots (note: these examples were re-sized for illustrative purposes).
-
We created a pandas DataFrame that contained the pixel data for the grey-scaled images. We did this separately for the line plots and the candle plots.
-
We used H2O.ai to develop machine learning algorithms. The images were classified as buy or no-buy. The model performance is evaluated and discussed.
- note: We excluded deep learning models from our list of learning algorithms. We made this decision because h2o does not use the full test sample to evaluate deep learning models. This default behavior cannot be changed when using the
H2OAutoMLfunction.
Our work can be reproduced by running the notebooks. Because of the amount of data, you can run a smaller version of the project in step 1. Both notebooks are linked below.
1a. Upload Plots
1b. Upload Plots (minimal example)
- Coming Soon!

