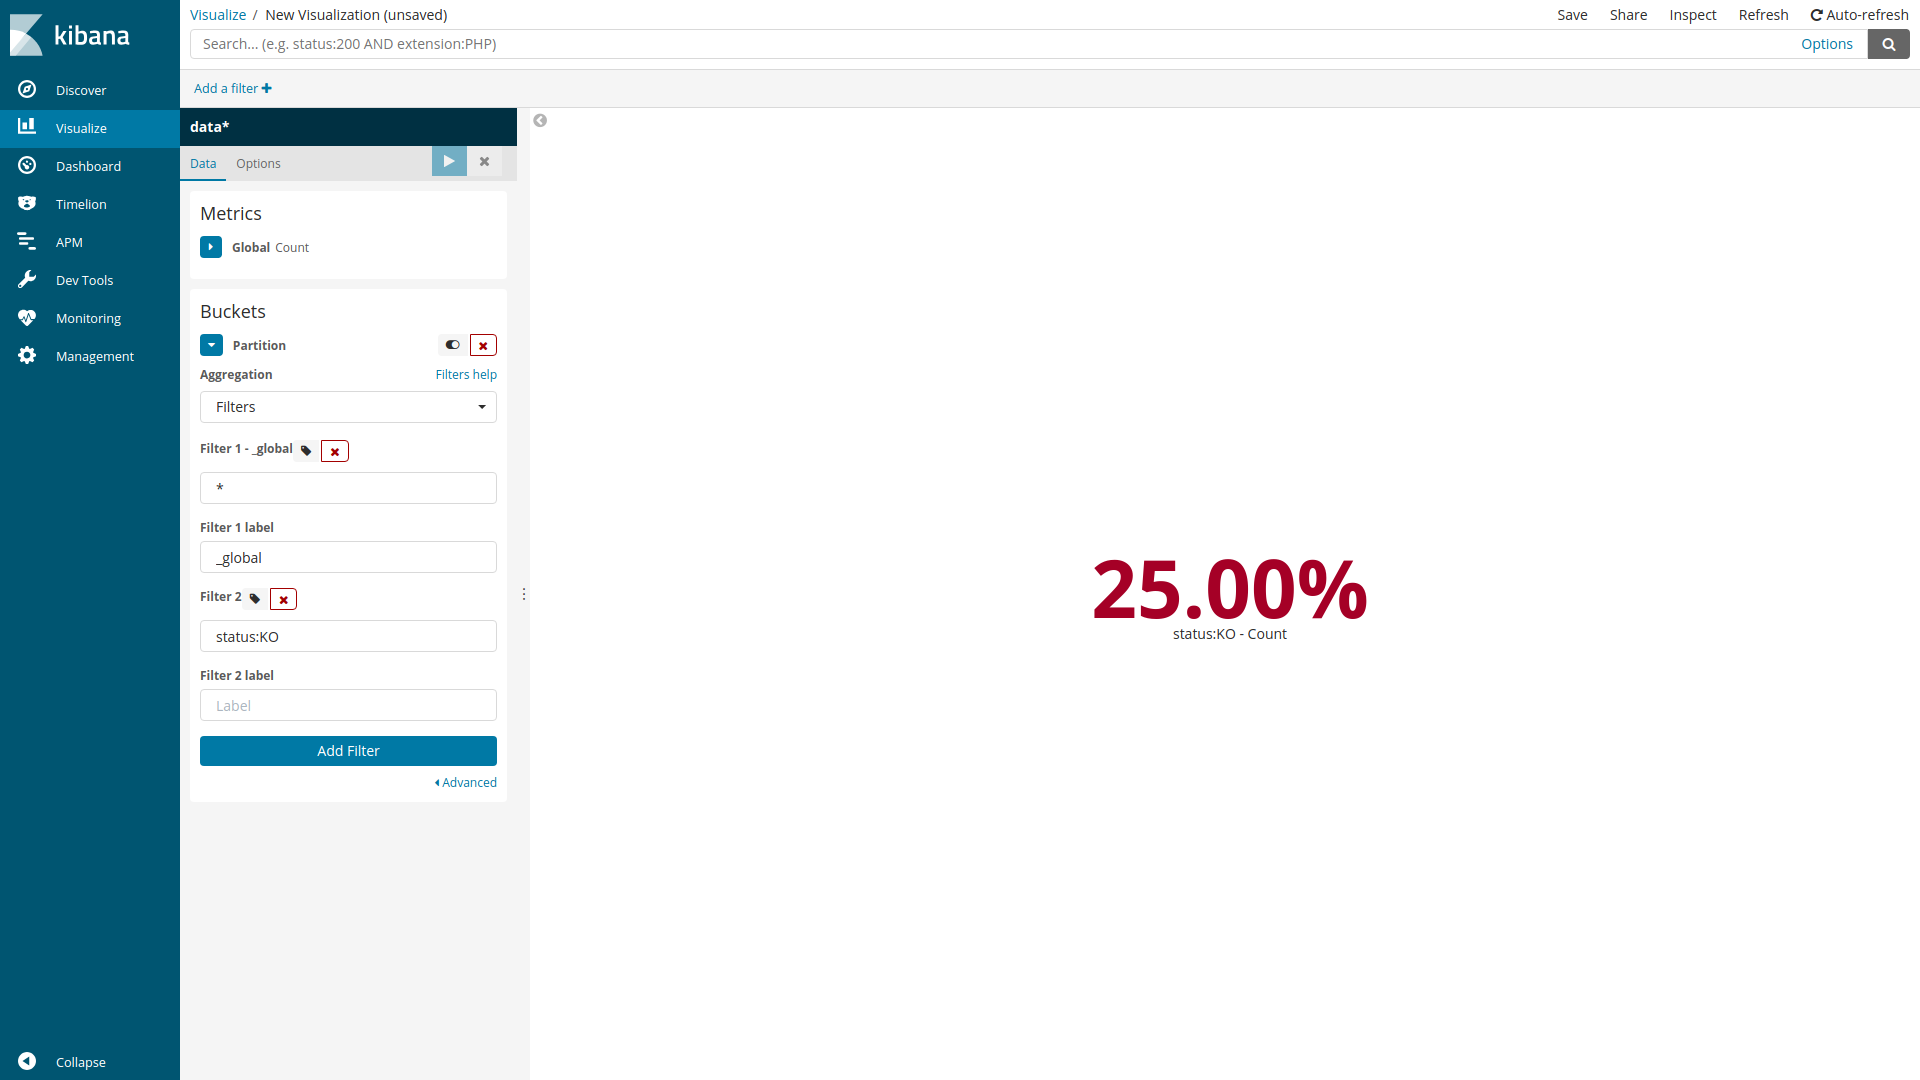
A percent visualization for Kibana, with builds available for both Kibana 4.6.x, Kibana 5.x.x and Kibana 6.x.x.
The visualization displays a percent number based on a global number and various values.
Different releases of the plugin are available to work with either Kibana 4 or Kibana 5 or Kibana 6.
All supported versions are properly tagged on this repository.
If this plugin isn't supported officially you can try to change the kibana version in package.json according to your needs.
You can test this plugin within a kibana docker container
#!/bin/bash
VERSION="6.4.2"
git clone https://github.com/amannocci/kibana-plugin-metric-percent plugins/kibana-plugin-metric-percent
docker run -it -d --net=host -e "ELASTICSEARCH_URL=http://localhost:9200" --name kibana-$VERSION -v $PWD/plugins:/usr/share/kibana/plugins docker.elastic.co/kibana/kibana:$VERSIONA script is provided to install this plugin properly.
It will download the right version of this plugin based on kibana version and create a zip compatible with kibana plugin manager in current directory.
It will also try to install it if needed.
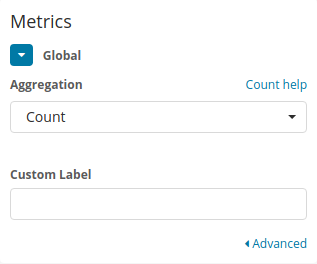
bash <(curl -Ss https://raw.githubusercontent.com/amannocci/kibana-plugin-metric-percent/master/scripts/setup-plugin.sh)The first step in creating the visualization is to configure the metric that will be displayed.
Select the Elasticsearch aggregation to be used - count and unique count are currently available.
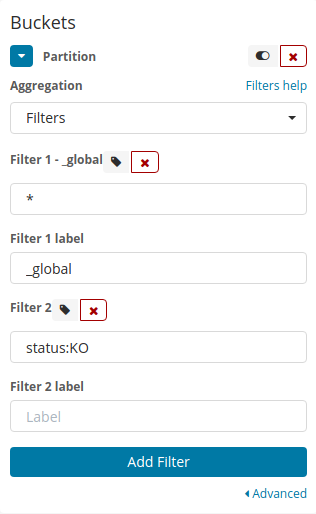
The next step is to configure some partitions.
You need to define a partition called _global which will be the base number.
Then you can define all others partitions with custom label.
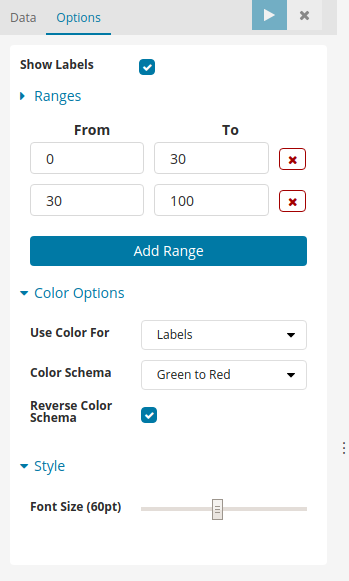
The options tab allows you to configure the font size and whether or not you want to display values behind percents.


