
![]()
The goal of fishatlas is to provide R client utilities for interacting with the Fish Brain Atlas Project, which has successfully acquired and registered almost 2,000 neurons from the larval zebrafish into a standard, annotated template space. Using this R package in concert with the natverse ecosystem of neuroanatomy tools is highly recommended. The project was conducted by the group of Herwig Baier at the MPI, primarily by Michael Kunst. The website was created by Nawwar Mokayes. The larval brain data has all been collected from fish at 6 days post-fertilisation.
Firstly, you will need R, R Studio and X Quartz as well as nat and its dependencies. For detailed installation instructions for all this, see here. It should not take too long at all. Then:
# install
if (!require("devtools")) install.packages("devtools")
devtools::install_github("natverse/fishatlas")

# use
library(fishatlas)
Done!
Now we can have a look at what is available, here are some of the key functions. Their help details examples of their use. You can summon the help in RStudio using ? followed by the function name.
# And how can I download and read neurons?
?fishatlas_read_saved_neurons()

# Get a 3D neuropil-subdivided brain model
?fishatlas_read_brain # Get 3D neuropil-subdivided brain models for those brainspacesLet's also have a look at an example pulling neurons and brain meshes from fishatlas.neuro.mpg.de. Excitingly, all the data is in a single standard template space!
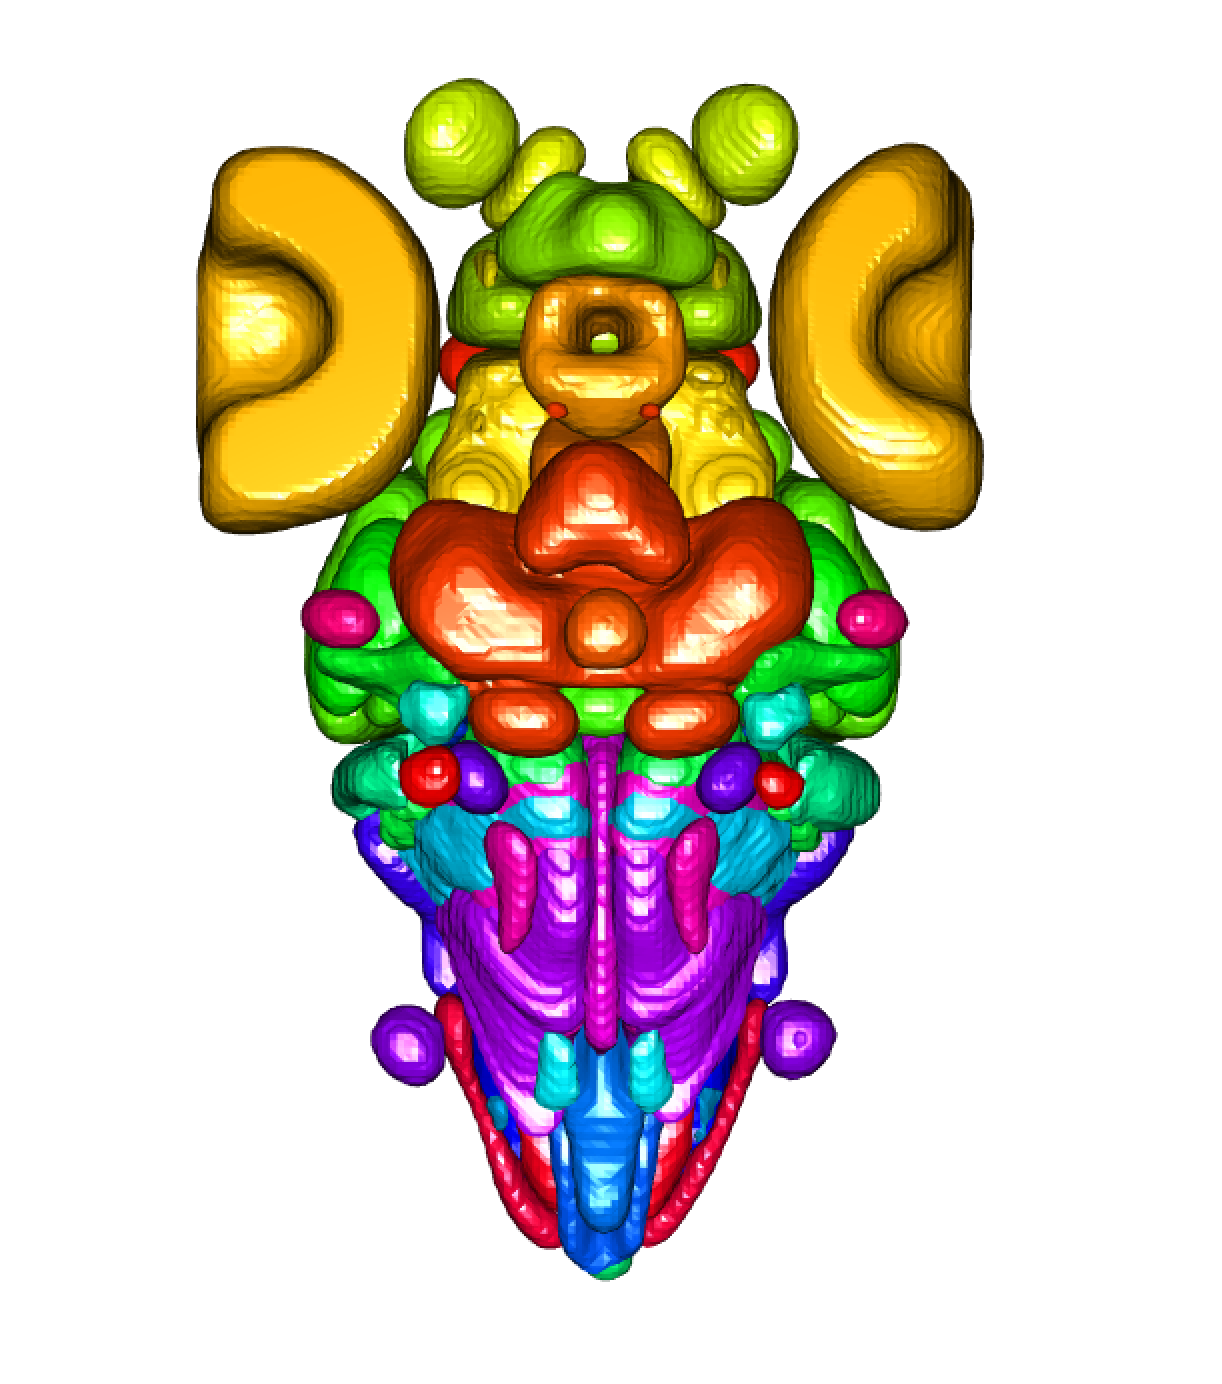
## Lets have a look at these neuropils!
zfbrain = fishatlas_read_brain(type = "brain_regions")
plot3d(zfbrain)

## Maybe we just want to plot for forebrain
clear3d()
plot3d(subset(zfbrain, "Forebrain"), alpha = 0.5, col = "red")

## Maybe within the forebrain, we are interested in plotting the habenula
plot3d(subset(zfbrain, "Habenula"), alpha = 0.3, col = "red")

## First we need to download all of the neurons
### We should only ever have to do this once!
fishatlas_download_neurons()

## Let's get all that sweet neuron data!
zfishn = fishatlas_read_saved_neurons(side = "Original")
plot3d(zfishn,soma = TRUE, lwd = 2)

## Hmm, but it would be better to have them all on the same side
clear3d()
zfishr = fishatlas_read_saved_neurons(side = "Right")
plot3d(zfishr,soma = TRUE, lwd = 2, col = "red")

## Great! How does that compare with neurons all on the left?
### Let's just look at the first 10 mirored.
zfishl = fishatlas_mirror_saved_neurons(fishatlas_neurons[1:10], side = "Left")
plot3d(zfishl,soma = TRUE, lwd = 2, col = "cyan")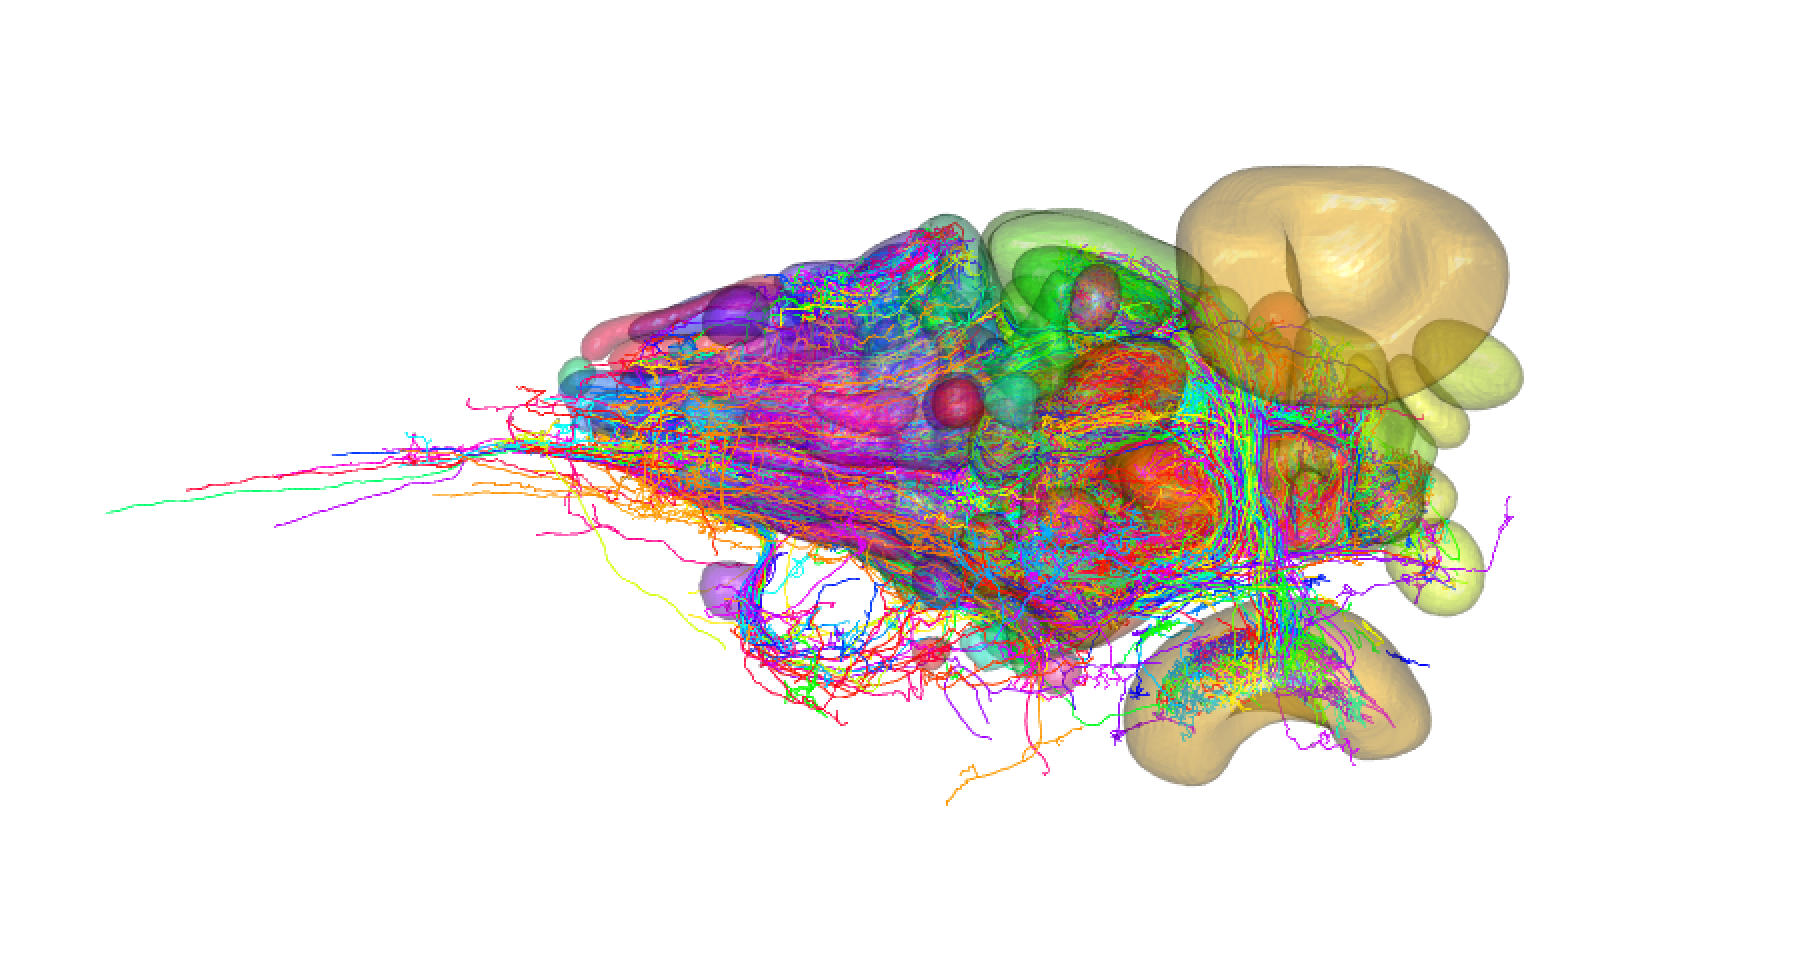
Any work that uses data from this package should cite
Kunst, Michael, Eva Laurell, Nouwar Mokayes, Anna Kramer, Fumi Kubo, António M. Fernandes, Dominique Förster, Marco Dal Maschio, and Herwig Baier. 2019. A Cellular-Resolution Atlas of the Larval Zebrafish Brain. Neuron, May. https://doi.org/10.1016/j.neuron.2019.04.034.
This package was created by Alexander Shakeel Bates, while in the group of Dr. Gregory Jefferis. You can cite this package as:
citation(package = "fishatlas")Bates AS (2019). fishatlas: R client utilities for interacting with the MPI Fish Brain Atlas project. R package version 0.1.0. https://github.com/natverse/fishatlas