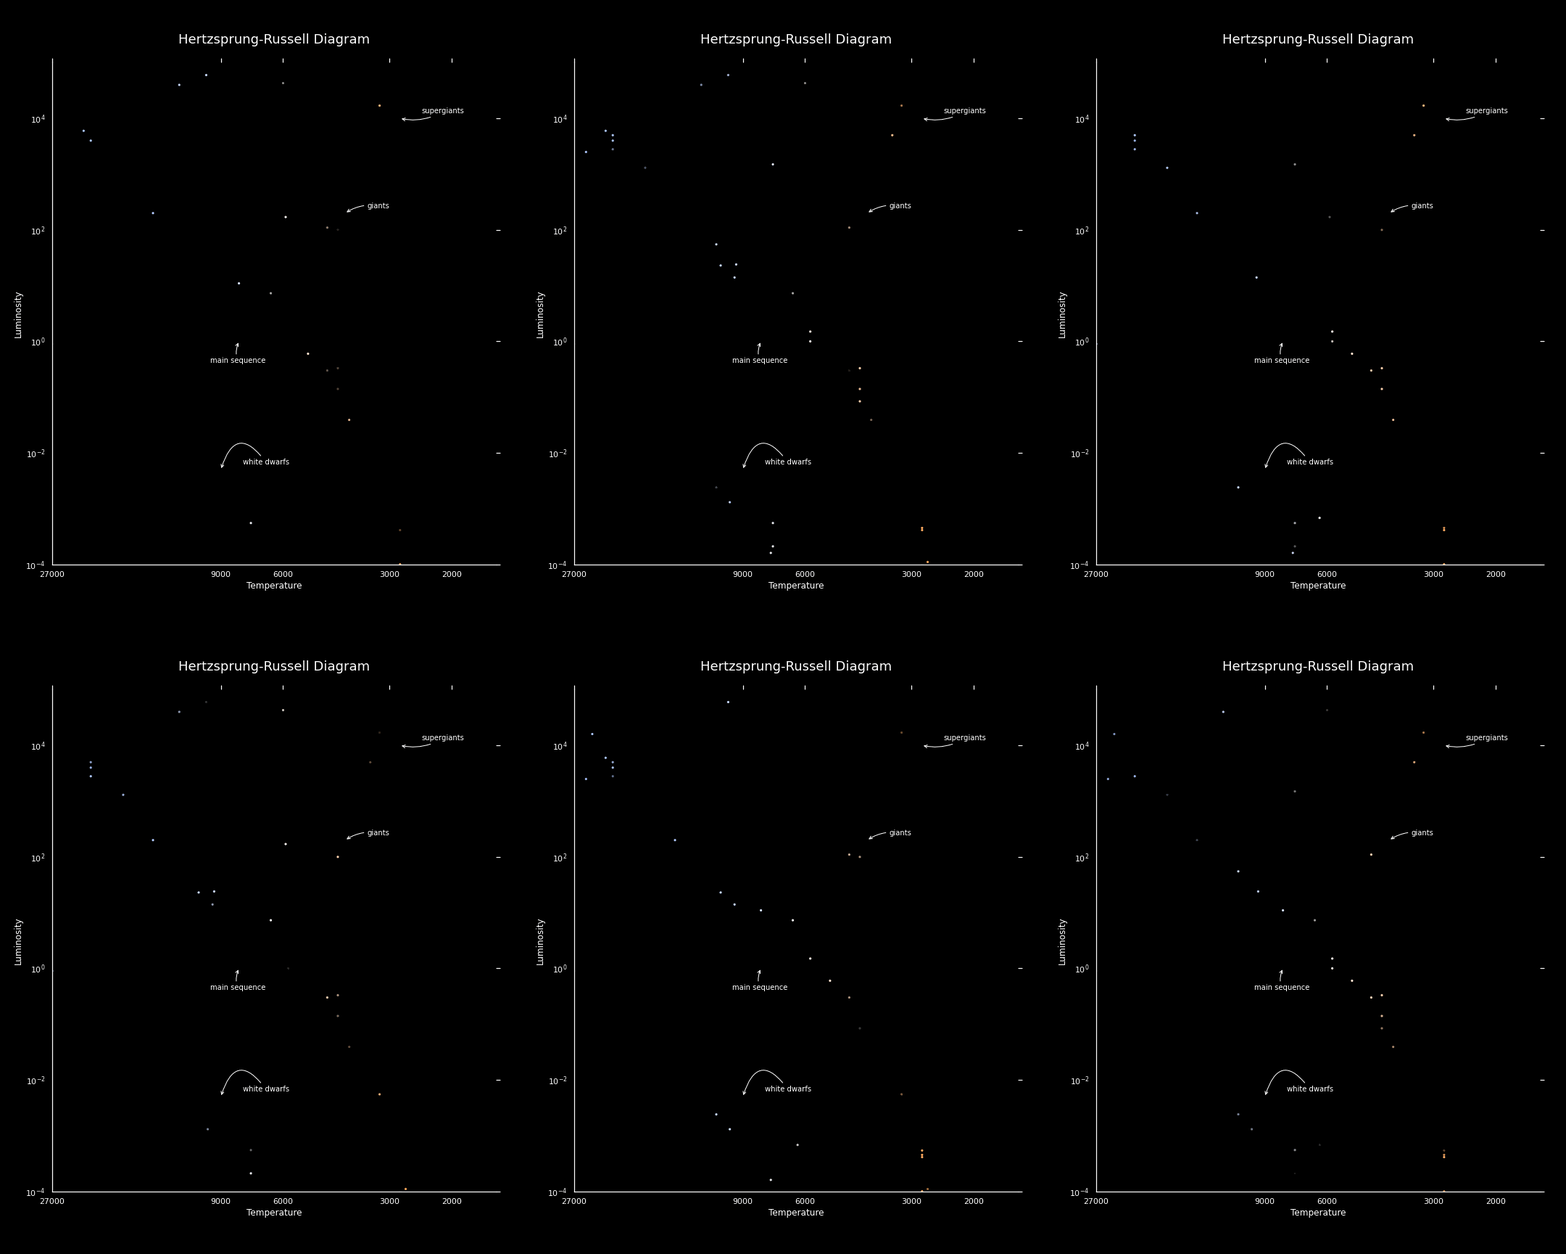
The Hertzsprung–Russell diagram, abbreviated H–R diagram or HRD, is a scatter graph of stars showing the relationship between the stars' absolute magnitudes or luminosities versus their spectral classifications or effective temperatures. More simply, it plots each star on a graph measuring the star's brightness against its temperature (color). It does not map any locations of stars.
- Based on RobertoIA's original work
