Goal
Templates for creating pretty graphs in Matlab.
Required dependencies
Build and install
No build or installation is required.
- Download the code (Code → Download ZIP).
- Extract zip folder.
- Open Matlab.
- Navigate to the unzipped
graph_templates_in_matlabdirectory. - Navigate to
src/.
Run
Here are a few examples to start quickly.
Line plot
- Run the script:
src/line_plot.m.
Line subplot
- Run the script:
src/line_subplot.m.
Range angles
- Run the script:
src/range_plot.m.
What is happening?
Line plot
- Configures the figure window (width and height).
- Creates some sample data points (substitute data_x, data_y1, and data_y2 for your data).
- Plots data with specific colors and line widths.
- Configures labels and axes limits.
- Saves graph at folder
fig.
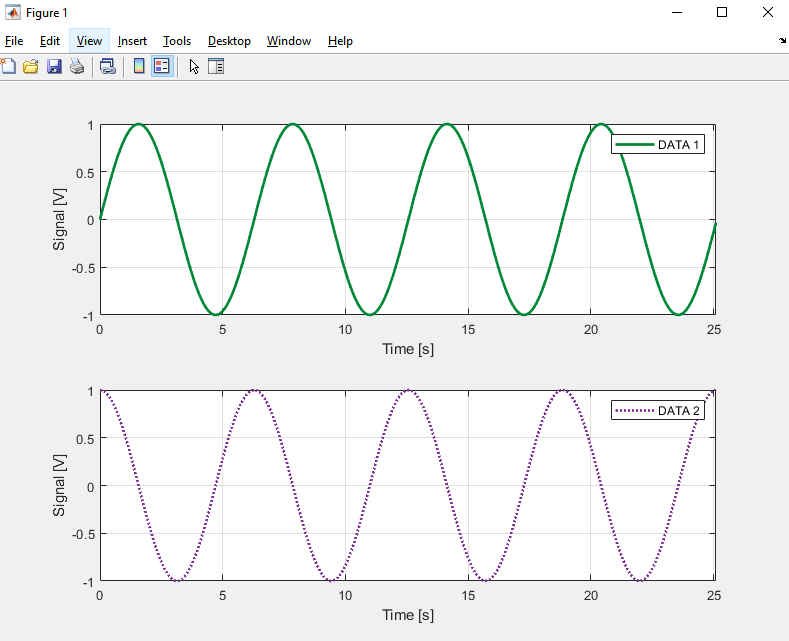
Line subplot
- Configures the figure window (width and height).
- Creates some sample data points (substitute data_x, data_y1, and data_y2 for your data).
- Plots data with specific colors and line widths. It creates subplots in horizontal positions.
- Configures labels and axes limits.
- Link axes between subplots.
- Saves graph at folder
fig.
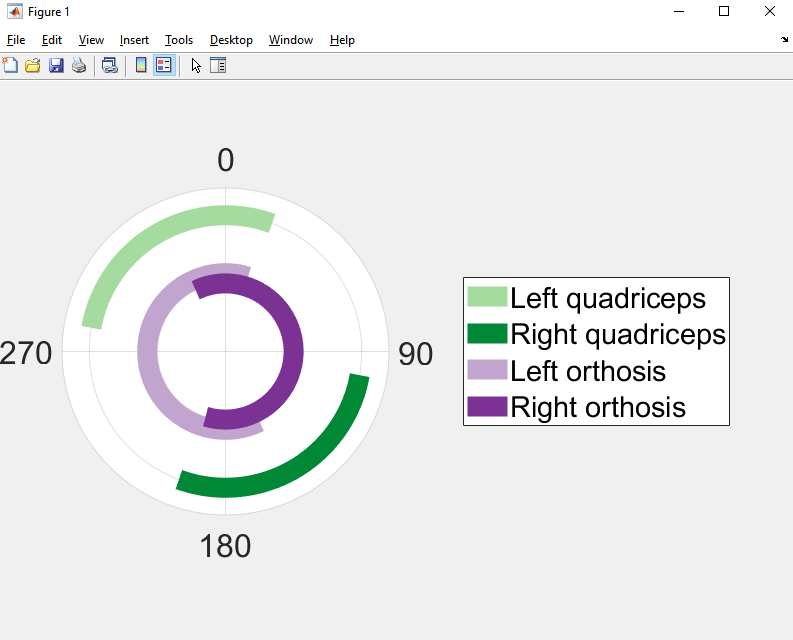
Range angles
- Configures the figure window (width and height).
- Defines line colors, width, and rhos.
- Creates some sample data points.
- Configures direction, tick labels, and zero locations.
- Saves graph at folder
fig.
Colors
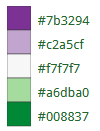
Colors were selected from ColorBrewer (colorblind safe and print-friendly).
Advanced tips for Matlab
Set an export setup template.
- Open the created figure window in Matlab.
- File -> Export setup
- Play around with width, colorspace, fonts, lines.
- Apply to Figure. Take a look, see if it looks better. Usually, I increase the font size and the line width.
- Save your "style" in Export Styles, "Save as style named." Now, every time you open a new figure, you can load your style. It makes the process quicker and more standardized.
- Export your figure as .fig and .pdf. With .fig, you can open it again and change settings (so you don't have to process data or run scripts). With .pdf, you don't lose resolution when zooming in.


