Home Assistant & Node Red Implementation of Malaysia Covid Stats
| How it Works | Pre-requisites | Installation | Credits |
Original sharing in FB Home Assistant Malaysia group by Jimmy93 (FB:A Jim) which implements Malaysia COVID-19 Statistic for use in Home Assistant(HA) with HA configuration.yaml triggering command line call of python script.
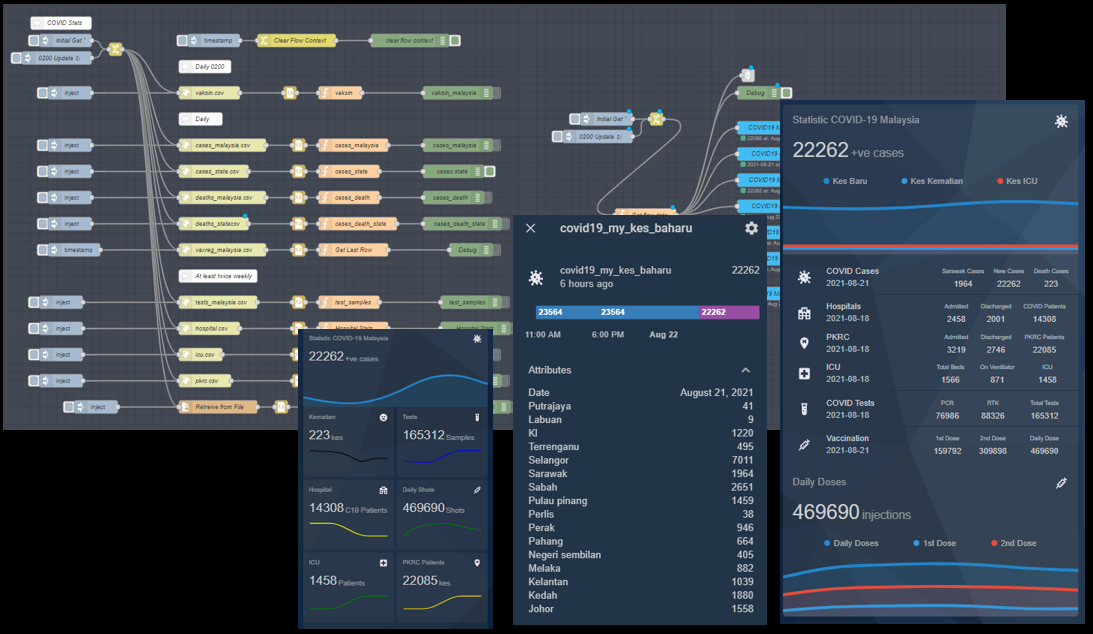
This reimplements similar functions but instead uses Node-Red.
Update Release 2: August 2021
Wnaarifin repo stopped daily updates since 3rd August 2021. I have re-work on the flows to retrieve the more comprehensive open data made available recently by MOH AND CITF.
-
Due to limitation (or my lack of know-how) backdated data or remapping of data to dates cannot be posted in Home Assistant database for now - hence retreived and posted data to HA will be timestamped (to HA's time) at time of data posted to HA.
-
Array pop() on function node returns last row; which would correspond to latest data.
-
For state datasets; which contains at least 16 rows per date; on first
pop()- the date for the data is stored and checked to ensure the remaining 15 rows retrieved have the same date before it is retrieved and stored. -
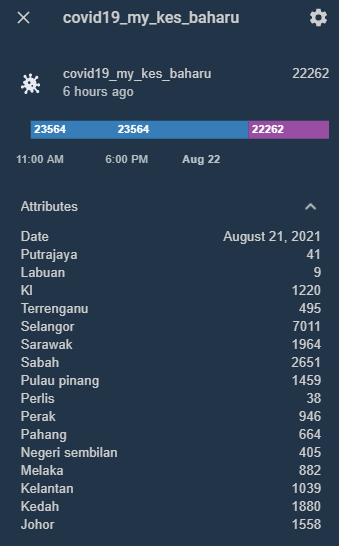
Rather than sending each data to HA as individual sensors - each dataset corresponding individual data is send to HA entities as attributes.
-
This however makes assessing the attributes data a little bit tricky where not all
lovelacecards can directly display attributes - hence workaround required:- Custom lovelace panels for displaying attribute data; refer sample in Lovelace and pre-requisites.
- Mapping only done when limited by what lovelace can call and would be more meaningful (look at the bright side - Daily vaccination statistics!).
-
Telegram node
/getcovidstatsfor manual call request and sets flags to identify at output to only send Telegram update when requested.
- Home Assistant with Node-Red including Node-Red companion integration; installed via HACS to enable sensor creation from Node-Red. Refer my other writeup guide on howto.
- Optional - Telegrambot and Chat ID. Also ref writeup.
- Node-Red.
- Import Flow into Node Red (Upper Right burger stack -> Import).
- Ensure Telegrambots and Home Assistants node Servers are configured before clicking deploy.
- Click on
injectnode to test you have data.
Tip: Use
link in/link outto simplify and link repetitive task i.e. send to Telegram.
- Additional: The missing
link-inTelegram node can be imported here.
- Home Assistant - Sensors
- Under
Configuration -> Integrations -> Node-Redfollowing created entities should now be made available:sensor.covid19_my_daily_statsfromcases_state.csvsensor.covid19_my_hosp_statsfromhospital.csvsensor.covid19_my_icu_statsfromicu.svsensor.covid19_my_kes_baharualso fromcases_state.csvsensor.covid19_my_kes_kematianfromdeath_state.csvsensor.covid19_my_pkrc_statsfrompkrc.csvsensor.covid19_my_test_samplesfromtest_malaysia.csvsensor.covid19_my_vaxfromvaxreg_malaysiasensor.vaksin_dose1_dailysensor.vaksin_dose1_cumulsensor.vaksin_dose2_dailysensor.vaksin_dose2_cumulsensor.vaksin_total_dose_dailysensor.vaksin_total_dose_cumulative
- Home Assistant - Lovelace
With this new (and complex) data set from MOH and CITF - there is more that can be done choose/crunch/omit. Inspired by
For lovelace custom cards - install the following from HACS.
-
Vertical stack in card to combine cards together without border.
-
Mini graph card for graph visualization.
-
Multiple Entity Row for display of multiple attributes.
- Lovelace - Import and customize to your liking.
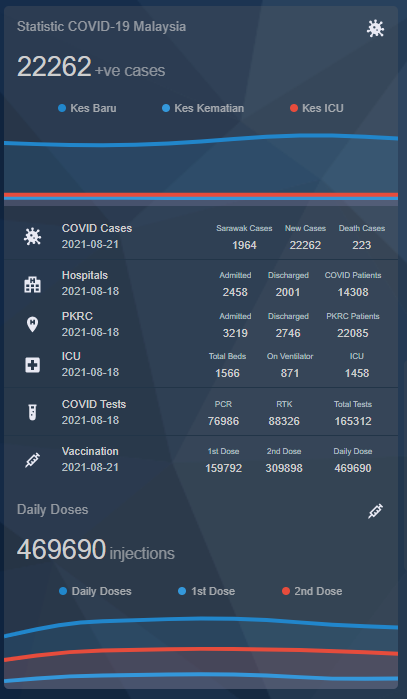
- Multiple Entry Row Version
type: custom:vertical-stack-in-card
style: |
  ha-card {
    font-size: 6 px
    box-shadow:
      {% if is_state('sun.sun', 'above_horizon') %}
        -4px -4px 8px rgba(255, 255, 255, .5), 5px 5px 8px rgba(0, 0, 0, .03);
      {% elif is_state('sun.sun', 'below_horizon') %}
        -5px -5px 8px rgba(50, 50, 50, .2), 5px 5px 8px rgba(0, 0, 0, .08);
      {% endif %}
   }
    .card-header {
    font-size: 6 px
  }
cards:
  - type: custom:mini-graph-card
    name: Statistic COVID-19 Malaysia
    unit: +ve cases
    icon: mdi:virus
    hours_to_show: 168
    points_per_hour: 0.1
    group_by: date
    entities:
      - entity: sensor.covid19_my_kes_baharu
        name: Kes Baru
      - entity: sensor.covid19_my_kes_kematian
        name: Kes Kematian
      - entity: sensor.covid19_my_icu_stats
        name: Kes ICU
  - type: entities
    entities:
      - entity: sensor.covid19_my_kes_baharu
        type: custom:multiple-entity-row
        name: COVID Cases
        show_state: false
        styles:
          width: 80px
        secondary_info:
          attribute: date
          styles:
            font-weight: bold
        entities:
          - attribute: sarawak
            name: Sarawak Cases
          - entity: sensor.covid19_my_kes_baharu
            name: New Cases
          - entity: sensor.covid19_my_kes_kematian
            name: Death Cases
      - type: section
      - entity: sensor.covid19_my_hosp_stats
        type: custom:multiple-entity-row
        name: Hospitals
        state_header: COVID Patients
        styles:
          width: 80px
        secondary_info:
          attribute: date
          styles:
            font-weight: bold
        entities:
          - attribute: admitted_covid
            name: Admitted
            styles:
              width: 50px
          - attribute: discharged_covid
            name: Discharged
            styles:
              width: 50px
      - entity: sensor.covid19_my_pkrc_stats
        type: custom:multiple-entity-row
        name: PKRC
        state_header: PKRC Patients
        styles:
          width: 80px
        secondary_info:
          attribute: date
          styles:
            font-weight: bold
        entities:
          - attribute: total_admitted
            name: Admitted
            styles:
              width: 50px
          - attribute: total_discharged
            name: Discharged
            styles:
              width: 50px
      - entity: sensor.covid19_my_icu_stats
        type: custom:multiple-entity-row
        name: ICU
        state_header: ICU
        styles:
          width: 70px
        secondary_info:
          attribute: date
          styles:
            font-weight: bold
        entities:
          - attribute: total_beds_for_covid
            name: Total Beds
            styles:
              width: 60px
          - attribute: total_ventilator_covid
            name: On Ventilator
            styles:
              width: 65px
      - type: section
      - entity: sensor.covid19_my_test_samples
        type: custom:multiple-entity-row
        name: COVID Tests
        state_header: Total Tests
        styles:
          width: 80px
        secondary_info:
          attribute: date
          styles:
            font-weight: bold
        entities:
          - attribute: pcr
            name: PCR
            styles:
              width: 60px
          - attribute: rtk-ag
            name: RTK
            styles:
              width: 60px
      - type: section
      - entity: sensor.covid19_my_vax
        type: custom:multiple-entity-row
        name: Vaccination
        state_header: Daily Dose
        styles:
          width: 80px
        secondary_info:
          attribute: date
          styles:
            font-weight: bold
        entities:
          - attribute: daily_1st_dose
            name: 1st Dose
            styles:
              width: 60px
          - attribute: daily_2nd_dose
            name: 2nd Dose
            styles:
              width: 60px
  - type: custom:mini-graph-card
    entities:
      - entity: sensor.vaksin_total_dose_daily
        name: Daily Doses
        unit: injections
      - entity: sensor.vaksin_dose1_daily
        name: 1st Dose
      - entity: sensor.vaksin_dose2_daily
        name: 2nd Dose
    hours_to_show: 168
    points_per_hour: 0.1
    group_by: date
-
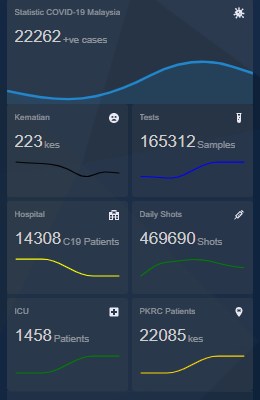
Mini graph version
type: custom:vertical-stack-in-card
style: |
  ha-card {
    font-size: 6 px
    box-shadow:
      {% if is_state('sun.sun', 'above_horizon') %}
        -4px -4px 8px rgba(255, 255, 255, .5), 5px 5px 8px rgba(0, 0, 0, .03);
      {% elif is_state('sun.sun', 'below_horizon') %}
        -5px -5px 8px rgba(50, 50, 50, .2), 5px 5px 8px rgba(0, 0, 0, .08);
      {% endif %}
   }
    .card-header {
    font-size: 6 px
  }
cards:
  - type: custom:mini-graph-card
    name: Statistic COVID-19 Malaysia
    unit: +ve cases
    icon: mdi:virus
    hours_to_show: 168
    points_per_hour: 0.1
    group_by: date
    entities:
      - entity: sensor.covid19_my_kes_baharu
        name: Kes Baru
  - type: vertical-stack
    cards:
      - type: grid
        cards:
          - type: custom:mini-graph-card
            entities:
              - color: black
                entity: sensor.covid19_my_kes_kematian
                unit: kes
            name: Kematian
            hours_to_show: 168
            group_by: date
            show:
              state: true
              fill: false
          - type: custom:mini-graph-card
            entities:
              - color: blue
                entity: sensor.covid19_my_test_samples
                unit: Samples
            name: Tests
            hours_to_show: 168
            group_by: date
            show:
              state: true
              fill: false
          - type: custom:mini-graph-card
            entities:
              - color: Yellow
                entity: sensor.covid19_my_hosp_stats
                unit: C19 Patients
            name: Hospital
            hours_to_show: 168
            group_by: date
            show:
              state: true
              fill: false
          - type: custom:mini-graph-card
            entities:
              - color: Green
                entity: sensor.covid19_my_vax
                unit: Shots
            name: Daily Shots
            hours_to_show: 168
            group_by: date
            show:
              state: true
              fill: false
          - type: custom:mini-graph-card
            entities:
              - color: Green
                entity: sensor.covid19_my_icu_stats
                unit: Patients
            name: ICU
            hours_to_show: 168
            group_by: date
            show:
              state: true
              fill: false
          - type: custom:mini-graph-card
            entities:
              - color: gold
                entity: sensor.covid19_my_pkrc_stats
                unit: kes
            name: PKRC Patients
            hours_to_show: 168
            group_by: date
            show:
              state: true
              fill: false
        columns: 2
        square: false