- Architecture Diagram
- Project Set Up and Installation
- Dataset
- Automated ML
- Hyperparameter Tuning
- Model Deployment
- Suggestions to Improve
- References
The project is about the prediction of the Basic Education Development Index (Ideb) of high schools in Brazil. The Ideb is calculated from data on school approval, obtained from the School Census, and performance averages in the Basic Education Assessment System (Saeb) in Brazil. Ideb adds to the pedagogical focus of large-scale evaluations the possibility of synthetic results, which are easily assimilable, and which allow the establishment of educational quality goals for education systems.
In this project, I considered a regression problem, that is, a process where a model learns to predict a continuous value output for a given input data. For this project, I ran essentially two processes:
- First I applied AutoML where several models are trained to fit the training data. Then I chose and saved the best model, that is, the model with the best score.
- Second, using HyperDrive, I adjusted the hyperparameters and applied the Random Forest Regressor which consists of a meta estimator that fits a number of classifying decision trees on various sub-samples of the dataset and uses averaging to improve the predictive accuracy and control over-fitting.
The resolution of this problem is justified because educational indicators such as Ideb are desirable because they allow the monitoring of the country's education system. Its importance, in terms of diagnosis and guidance of political actions focused on improving the educational system, is in:
- detect schools and / or education networks whose students are underperforming in terms of performance and proficiency;
- monitor the temporal evolution of student performance in these schools and / or education networks.
This contains the Architecture Diagram of this project:

The starter files that you need to run this project are the following:
- automl.ipynb: Jupyter Notebook to run the autoML experiment
- hyperparameter_tuning.ipynb: Jupyter Notebook to run the Hyperdrive experiment
- train.py: Script used in Hyperdrive
- score.py: Script used to deploy the model
- ideb_dataset.csv: The dataset prepared after the release of the Basic Education Development Index (Ideb) by the National Institute for Educational Studies and Research Anísio Teixeira (Inep).
The data were obtained from the 2019 School Census and released on September 15, 2020 by Inep, which can be found at http://download.inep.gov.br/educacao_basica/portal_ideb/planilhas_para_download/2019/divulgacao_ensino_medio_municipios_2019.zip.
Considering that Ideb was developed to be an indicator that synthesizes information from performance in standardized exams with information on school performance (average rate approval of students in the teaching stage), the features used to predict Basic Education Development Index were:
- Total Approval Rate (2019): In the database called "TAprov2019 Total"
- 1st Series Approval Rate (2019): In the database called "TAprov2019_1_serie"
- 2nd Series Approval Rate (2019): In the database called "TAprov2019_2_serie"
- 2nd Series Approval Rate (2019): In the database called "TAprov2019_3_serie"
- 4th Grade Approval Rate (2019): In the database called "TAprov2019_4_serie"
- Approval_Indicator: In the database called "Indicador de Rendimento"
- Grade SAEB Mathematics (2019): In the database called "SAEB2019_Matematica"
- Grade SAEB Language Portuguese (2019): In the database called "SAEB2019_Lingua Portuguesa"
- SAEB Standardized Average Score (N): In the database called "SAEB2019_Nota Media Padronizada"
Initially, I explored the Ideb database repository on the Inep website to obtain a set of data to train the models. As soon as I decided to work with the Ideb 2019 data set by high school, I found the link to download the data. The link was then passed to the from_delimited_files method of the Tabular class object of the Dataset class object.
To configure the Automated ML run we need to specify what kind of a task we are dealing with, the primary metric, train and validation data sets (which are in TabularDataset form) and the target column name. Featurization is set to "auto", meaning that the featurization step should be done automatically.
The best model overall was the VotingEnsemble model, with an R2 Score of 0.99787. The remainder of the models were between about 0.75571 and 0.99786, except VotingEnsemble.
The AutoML run has the following parameters:
-
task: To help manage child runs and when they can be performed, we recommend you create a dedicated cluster per experiment. In this project,
4was the number of concurrent child runs/iterations. -
max_concurrent_iterations: This is the metrics which is optimised during the training of the model algorithm. For example, Accuracy, Area Under Curve(AUC), R2 Score, etc. In this project,
R2 Scorewas used as an success metrics. -
primary_metric: This is the metrics which is optimised during the training of the model algorithm. For example, Accuracy, Area Under Curve(AUC), R2 Score, etc. In this project,
R2 Scorewas used as an success metrics. -
experiment_timeout_minutes: This is the max time for which the AutoML can use different models to train on the dataset. In this project, the max timeout in hours was
0.5. -
training_data: This is the training data on which all the different models are trained on. In this project, it was
ideb_dataset. -
label_column_name: This is the variable which is predicted by the model. In this project, it was the
IDEB_2019. -
n_cross_validations: This is the n in cross validation process. Cross validation is the process where different data points are put into training and testing dataset (resampling) to ensure that the model does not overfit over certain values. In this project, the n was
3. -
featurization: This help certain algorithms that are sensitive to features on different scales. For example, you can enable more featurization, such as missing-values imputation, encoding, and transforms. In this project, the featurization was
auto(specifies that, as part of preprocessing, data guardrails and featurization steps are to be done automatically).
This contains the RunDetails widget from the Jupyter notebook implementation in the case of AutoML run:

The following screenshots shows the iteration

The following screenshots shows the best run ID:

For a complete code overview, I refer to the jypter notebook automl.ipynb. We can perhaps improve the mean absolute error score by:
- Enable logging in the deployed web app
- Convert the model to ONNX format
- Increasing the number of iterations
- Evaluate other regression models.
The objective of this project is to predict the Ideb per school at the Brazilian middle level. According to the data, the target variable "IDEB_2019" is a floating variable, which is a continuous variable ranging from 1.0, 1.6, 2.5, 3.5, 7.5 etc., therefore, it deals with yourself from a regression problem. In this case, then use regression models such as linear regression, random forest regression or any other regression model. Considering that in the classification model, I need to convert the target resource - "IDEB_2019" into a categorical resource with 1 or 0, not being suitable for the purpose of this project, it is evident that this is a regression problem.
Since the task was a regression problem, the model used the Random Forest Regressor, since: (i) It is one of the most accurate learning algorithms available. For many data sets, it produces a highly accurate classifier; (ii) It runs efficiently on large databases; (iii) It can handle thousands of input variables without variable deletion; (iv) It generates an internal unbiased estimate of the generalization error as the forest building progresses; (v) It has an effective method for estimating missing data and maintains accuracy when a large proportion of the data are missing.
For the hyperparameter adjustment experiment, done via HyperDrive, the types of parameters and their ranges group the following parameters:
-
primary_metric_name: This is the metrics which is optimised during the training of the model algorithm. For example, Accuracy, Area Under Curve(AUC) etc. In this project,
R2 Scoreis used as an success metrics. -
primary_metric_goal: This is the parameter which tells Hyperdrive how to optimise the algorithm using the primary_metric_name given. The goal can be anything from Maximize to Minimise the primary_metric_name. In this project, it is
PrimaryMetricGoal.MAXIMIZE. -
max_total_runs: This is the maximum number of runs which Hyperdrive will run using different hyperparameters. In this project, the max_total_runs is
40. -
max_concurrent_runs: This is the maximum number of run which run concurrently over different threads. In this project, the max_concurrent_runs is
8. -
hyperparameter_sampling: This is the Parameter Sampler which specfies the techniques in which the hyperparameters are tuned. In this project, RandomParameterSampling was used to tune the hyperparameter '--max_depth' with
choice(range(1, 20), '--min_samples_split' withchoice(2, 5, 10, 15, 100)and '--min_samples_leaf' withchoice(range(1, 10). -
policy: This is the early stopping policy used by Hyperdrive which is used to provide guidance as to how many iterations can be run before the model begins to overfit. In this project, BanditPolicy was used with argument evaluation_interval of
2and slack_factor of0.1. BanditPolciy terminates any run whos primary metrics is less than the slack factor of best run. -
RunConfig: There are several methods for setting up a training job in Azure Machine Learning through the SDK. This is the training script that will be run with the sample hyperparameters. For exemple, Estimators, ScriptRunConfig, and the lower-level RunConfiguration. In this project
ScriptRunConfig(It defines the resources per job (single or multi-node), and the compute target to use).
This contains the RunDetails implementation in the case of Hyperdrive run.
The best model of HyperDrive run was VotingEnsemble with 0.99787 R2 Score. This contains the RunDetails implementation of the the best model trained with it's parameters:

This shows that the best model generated by Hyperdrive with its run id:

Some ideas on how to perhaps improve the The best model of HyperDrive:
- Test different sampling methods
- Specify different types of hyperparameter distributions
- Exploring another range of values defined for each hyperparameter
- Exploring another early termination policy
- Increasing the number of iterations
For a complete code overview, I refer to the jypter notebook automl.ipynb.
Summarizing the results, the best model generated by AutoML 38 models among with the VotingEnsemblehad performed the best with 0.99787 R2 Score. On the other hand, The Hyperdrive generated 40 models and the best model when running HyperDrive was with 0.9978595055572106 R2 Score. So, I implemented the best model - which happened to be the VotingEnsemble model for executing AutoML, as an endpoint.
The AutoML generated 103 models among with the VotingEnsemble performed the best with 0.99787 R2 Score. On the other hand, The Hyperdrive generated 48 iterations with the Logistic Regression Model with different hyperparameter tuning of min_samples_leaf, min_samples_split and max_depth parameters and achieved an R2 Score of 0.9978595055572106 with min_samples_leaf as 3, min_samples_split as 5 and max_depth as 15. Therefore the Hyperdrive Model has been deployed.
This contains the Endpont active:

The best model is deployed following this steps:
- Register the model: In addition to the content of the model file itself, your registered model will also store model metadata -- model description, tags, and framework information -- that will be useful when managing and deploying models in your workspace;
- Prepare an inference configuration: An inference configuration describes how to set up the web-service containing your model. It's used later, when you deploy the model;
- Prepare an entry script (used score.py): The entry script receives data submitted to a deployed web service and passes it to the model. It then takes the response returned by the model and returns that to the client. The entry_script used as an input to InferenceConfig was "score.py", which is the best working model generated from Hyperdrive;
- Choose a compute target: The compute target you use to host your model will affect the cost and availability of your deployed endpoint. The compute target choose was an Azure Container Instance which included the scoring script;
- Deploy the model to the compute target: Web services take one or more models, load them in an environment, and run them on one of several supported deployment targets. ;
- Test the resulting web service: After successful deployment, a REST endpoing with a scoring url was generated to be used for predictions as shown below:
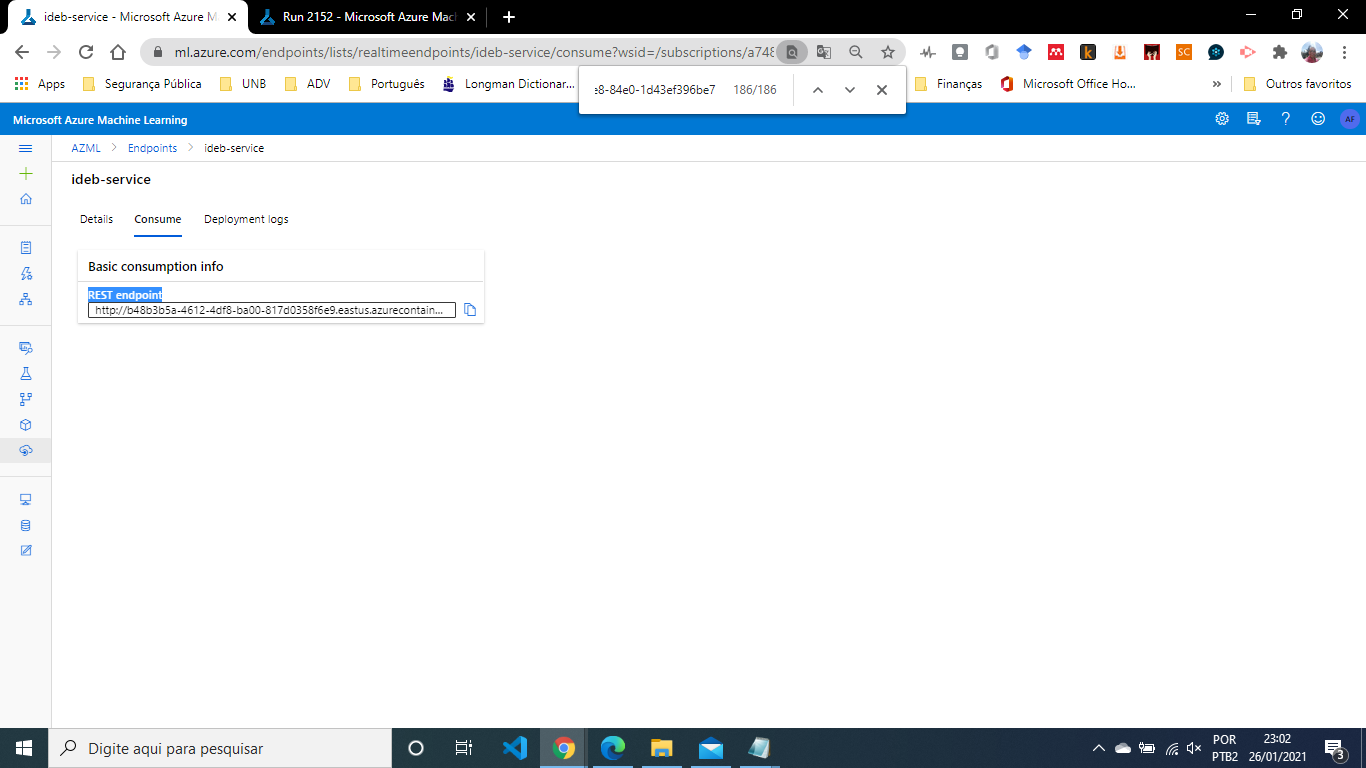

After deploying the model as a web service, a REST API endpoint was created. You can send data to this endpoint and receive the forecast returned by the model. This example demonstrates how I used Python to call the created web service:
import requests
import json

# scoring endpoint
scoring_uri = service.scoring_uri


# If the service is authenticated, set the key or token
#key = '<your key or token>'

# Two sets of data to score, so we get two results back
data = {"data":
        [
          {
           "TAprov2019_Total": 99.9,
           "TAprov2019_1_serie": 99.2,
           "TAprov2019_2_serie": 59.1,
           "TAprov2019_3_serie": 60.5,
           "TAprov2019_4_serie": 70.5,
           "Indicador_Rendimento": 0.99,
           "SAEB2019_Matematica": 365.38,
           "SAEB2019_Lingua Portuguesa": 351.54,
           "SAEB2019_Nota Media Padronizada": 7.055853
          },
      ]
    }
# Convert to JSON string
input_data = json.dumps(data)

# Set the content type
headers = {'Content-Type': 'application/json'}
# If authentication is enabled, set the authorization header
#headers['Authorization'] = f'Bearer {key}'

# Make the request and display the response
resp = requests.post(scoring_uri, input_data, headers=headers)
print(resp.text)
The result returned is similar to the following:
"{\"result\": [6.903481911249511]}"
That is, a high school with the features described in data {} has the result of Ideb 6.903481911249511.
At the end, I delete the ACI deployment as well as the compute cluster.
Some areas of improvement for future experiments are:
- Test different sampling methods
- Specify different types of hyperparameter distributions
- Enable logging in the deployed web app
- Change the search space
- Deploy the model to the Edge using Azure IoT Edge
- Exploring another range of values defined for each hyperparameter
- Exploring another early termination policy
- Using more data is the simplest and best possible way to prevent over-fitting
- Convert the model to ONNX format
- Increasing the number of iterations
- Setting the featurization to be auto
- Using neural network based regression
The implementation of these improvements in future work to improve the accuracy of the model and obtain new insights for the business. In addition, it is possible to develop pipelines that make it possible to reuse this model and continuous improvements.
- [Inep 2020] Nota Técnica cocepção IDEB. August 2020. https://download.inep.gov.br/educacao_basica/portal_ideb/o_que_e_o_ideb/Nota_Tecnica_n1_concepcaoIDEB.pdf
- [Microsoft 2020] BanditPolicy class - Azure Machine Learning Python | Microsoft Docs. https://docs.microsoft.com/en-us/python/api/azureml-train-core/azureml.train.hyperdrive.banditpolicy?view=azure-ml-py
- [Microsoft 2020] MedianStoppingPolicy class - Azure Machine Learning Python | Microsoft Docs. https://docs.microsoft.com/en-us/python/api/azureml-train-core/azureml.train.hyperdrive.medianstoppingpolicy?view=azure-ml-py
- [Microsoft 2020] Tune hyperparameters for your model with Azure Machine Learning | Microsoft Docs. https://docs.microsoft.com/en-us/azure/machine-learning/how-to-tune-hyperparameters#define-search-space
- [Microsoft 2020] RandomParameterSampling class - Azure Machine Learning Python | Microsoft Docs. https://docs.microsoft.com/en-us/python/api/azureml-train-core/azureml.train.hyperdrive.randomparametersampling?view=azure-ml-py
- [Microsoft 2020] Hyperparameter tuning a model with Azure Machine Learning | Microsoft Docs. https://docs.microsoft.com/en-us/azure/machine-learning/how-to-tune-hyperparameters?view=azure-ml-py
- [Microsoft 2020] Consume an Azure Machine Learning model deployed as a web service | Microsoft Docs. https://docs.microsoft.com/en-us/azure/machine-learning/how-to-consume-web-service?view=azure-ml-py&tabs=python#call-the-service-python
- [Microsoft 2020] What is automated machine learning (AutoML)? | Microsoft Docs. https://docs.microsoft.com/en-us/azure/machine-learning/concept-automated-ml?view=azure-ml-py
- [2007-2020, scikit-learn deveopers] sklearn.model_selection.train_test_split — scikit-learn 0.23.2 documentation. https://scikit-learn.org/stable/modules/generated/sklearn.model_selection.train_test_split.html
- [2007-2020, scikit-learn deveopers]sklearn.linear_model.RandomForestRegression — scikit-learn 0.23.2 documentation. https://scikit-learn.org/stable/modules/generated/sklearn.ensemble.RandomForestRegressor.html
- [GitHub 2021] Training of Python scikit-learn models on Azure. https://github.com/microsoft/MLHyperparameterTuning