-
app contains a sample python flask app behind a nginx proxy
-
grafana contains the monitoring stack
-
iac contains terraform configuration files to deploy the stack on a EC2 instance in AWS
-
monitoring-jobs contains shell scripts and/or python scripts that push custom metrics to pushgateway periodically.
git clone https://github.com/andregri/docker-compose-grafana.git
docker-compose -f docker-compose-grafana/grafana/docker-compose.yaml up -d
docker-compose -f docker-compose-grafana/app/docker-compose.yaml up -d- First create a EC2 key pair named "kp"
- Launch terraform configuration:
terraform init
terraform applyThe docker-compose stack for monitoring includes the nginx-exporter (Github repository) to collect metrics from the nginx server:
nginx-exporter:
  image: nginx/nginx-prometheus-exporter:0.10.0
  expose:
    - 9113
  command: -nginx.scrape-uri=http://proxy:80/stub_status
  networks:
    - monitoring
- app_frontnet- The exporter is added to the frontnet network where the nginx container is attached to.
-nginx.scrape-urioptions defines the endpoint where nginx expose the metrics. The endpoint /stub_status is activated in the conf file of nginx:
server {
    listen       80;
    server_name  localhost;
    location / {
        proxy_pass   http://backend:8000;
    }

    location /stub_status {
        stub_status;
    }
}
The exporter is added to the prometheus configuration file config/prometheus.yaml, under scrape_config object:
scrape_configs:
  # other targets
  # ...

  - job_name: 'nginx-website'
    scrape_interval: 15s
    metrics_path: '/metrics'
    static_configs:
- targets: ['nginx-exporter:9113']The docker-compose stack for monitoring includes the mongodb-exporter (Github repository) to collect metrics from the mongodb instance:
# grafana/docker-compose.yaml
mongodb-exporter:
  image: bitnami/mongodb-exporter:latest
  command: --compatible-mode --collect-all --mongodb.uri=mongodb://mongo:27017
  ports:
    - 9216
    - 17001
  networks:
    - monitoring
- app_backnet- The exporter is added to the backnet network where the mongodb is attached to.
--compatible-modeto tell mongodb-exporter to use the old metrics labels.--collect-allto expose all mongodb metrics- the metrics are available at
:9216/metrics
The exporter is added to the prometheus configuration file config/prometheus.yaml, under scrape_config object:
scrape_configs:
  # other targets
  # ...

  - job_name: "mongodb"
    static_configs:
      - targets: ["mongodb-exporter:9216"]
The Grafana dashboard to visualize the mongodb metrics is provisioned through the file dashboards/mongodb.json.

There are different approaches to provide custom metrics or data to prometheus:
- read data directly from a database using a Grafana data source
- send data to pushgateway
You can add a data source connected to your db.
- Edit
grafana/docker-compose.yamlto make sure grafana is in the same the network of the db - Edit
grafana/config/datasources.yaml:
apiVersion: 1

datasources:
  - name: MySQL
    type: mysql
    url: db:3306
    database: grafana
    user: grafana
    jsonData:
      maxOpenConns: 0 # Grafana v5.4+
      maxIdleConns: 2 # Grafana v5.4+
      connMaxLifetime: 14400 # Grafana v5.4+
    secureJsonData:
password: ${GRAFANA_MYSQL_PASSWORD}PROS:
- easy to setup
CONS:
- the refresh frequency depends on the frequecy of the dashboard
Stackoverflow guide that explaiins how to execute a cronjob on a docker container.
crontab.guru helps to understand cronjob format.
- Create a shell script in
monitoring_jobs/scripts/directory, for instancemysql-count-records.sh:
# Obtain the data
# Crontab can't read env variables from docker-compose... so parameters are hardcoded
RECORDS_COUNT=$(mysql --silent --host db --user root --password="$(cat /run/secrets/db-password)" --execute "SELECT COUNT(*) FROM blog" example)

# Keep only the last line that contains the query result
echo $RECORDS_COUNT | tail -1

# Send the data to pushgateway
echo "mariadb_blog_records_from_bash_total $RECORDS_COUNT" | curl --data-binary @- http://pushgateway:9091/metrics/job/bash- Add a cronjob to
monitoring_jobs/cron
* * * * * bash /scripts/mysql-count-records.sh >> /var/log/cron.log 2>&1 # every minute-
Setup
monitoring_jobs/Dockerfileto install the required dependencies -
Start the containers:
docker-compose up -d --build
PROS:
- shell script pros
CONS:
- unable to read env variables from docker-compose
- complex to parse metrics for pushgateway
- readability
- Create a shell script in
monitoring_jobs/scripts/directory, for instancemysql-count-records.py. Below, the code snippet to send a metric to pushgateway:
from prometheus_client import CollectorRegistry, Gauge, push_to_gateway
import mysql.connector

...

def push_metric(metric):
    registry = CollectorRegistry()
    # Define the metric type as a Gauge: set metric name and description
    # Metric name must be unique!
    g = Gauge('mariadb_blog_records_from_python_total', 'Count of records in blog table', registry=registry)
    # Set the metric value
    g.set(metric)
    # Send the metric to pushgateway
push_to_gateway('pushgateway:9091', job='python', registry=registry)- Add a cronjob to
monitoring_jobs/cron. See crontab.guru to understand cronjob format
* * * * * python3 /scripts/mysql-count-records.py >> /var/log/cron.log 2>&1 # every minute-
Setup
monitoring_jobs/Dockerfileto install the required dependencies with pip -
Start the containers:
docker-compose up -d --build
PROS:
- python pros
- readability
-
Prometheus guideline for naming metric.
-
Prometheus client library repository on Github
There two possible solutions to add alerts and notification to the monitoring system:
- Prometheus and Loki generate the alerts and Alertmanager notify the receivers. They are configurable by file provisioned through docker-compose.
- Grafana unified alert manager that includes alerts and notifications. At the moment, it is configurable via UI and it is not possible to re-use configuration files like for dashboards and datasources.
Alerts and notifications are configured with Prometheus that defines the alerting rule on the metrics and Alertmanager that listens to alerts and routes the notifications to the receivers.
In the docker-compose manifest, there are the services: prometheus, alertmanager, and mailhog that is a local smtp server to test email notifications.
- To setup the communication between Prometheus and Alertmanager, add the alerting section to the configuration file of Prometheus
prometheus.yamlto define the list of alertmanagers listening to alerts:
# Alertmanager configuration
alerting:
  alertmanagers:
    - static_configs:
      - targets:
- alertmanager:9093- Always in the Prometheus configuration file
prometheus.yaml, add the rule_files section to specify the file that defines the alerting rules:
# Rule files specifies a list of globs. Rules and alerts are read from
# all matching files.
rule_files:
  - rules.yaml
Also add the bind volume in the docker-compose:
volumes:
  - ./prometheus.yaml:/etc/prometheus/prometheus.yaml
- ./rules.yaml:/etc/prometheus/rules.yaml- Write the alerting expressions in the file
rules.yaml. See an example in the Prometheus documentation.
- Visit
http://localhost:9090/rulesto list the groups and rules defined inrules.yaml. - Visit
http://localhost:9090/alertsto get the alert list pending or firing.
- Configure alertmanager using the file
alertmanager-config.yamlto define smtp servers, alert routes, and receivers. See alertmanager official documentation for more information.
-
global section configures global options like smtp server
-
route section defines how incoming alerts are routed to the correct receiver. It can be nested to create more specific routes
-
inhibit_rules section defines when to stop notifications (e.g. don't send notifications for 'warning' alerts when a 'critical' alert triggered)
-
receivers section defines the communication endpoint (e.g. slack, email, etc.) for each receiver
-
To test alertmanager, send an alert using curl:
curl -H 'Content-Type: application/json' -d '[{"labels":{"alertname":"myalert"}}]' http://localhost:9093/api/v2/alerts- Then visit alertmanager web ui
http://localhost:9093/#/alertsand check there is a new alert myalert and visit the smtp server (if using mailhog, athttp://localhost:8025/) to see the notification.
To setup email notification in Grafana, modify smtp section in /etc/grafana/grafana.ini:
hostfor smtp server and portuserandpasswordfor smtp authenticationfrom_nameandfrom_addressfor email info
-
The
rulersection of theloki-config.yamlfile defines the folder where to find the rule file and alertmanager endpoint -
The
loki-rules.yamlfile works the same as the prometheus rule file. For example, the expression to monitor the rate of error logs of the container app-flog-1 is:
sum(rate({container="app-flog-1"} |= "error" [5m])) by (job)
  /
sum(rate({container="app-flog-1"}[5m])) by (job)
  > 0.05
- To check that the Loki rules are loaded correctly:
- get the rule file from Loki:
http://localhost:3100/loki/api/v1/rulesor - view parsed rules from Grafana interface:
http://localhost:3000/alerting/list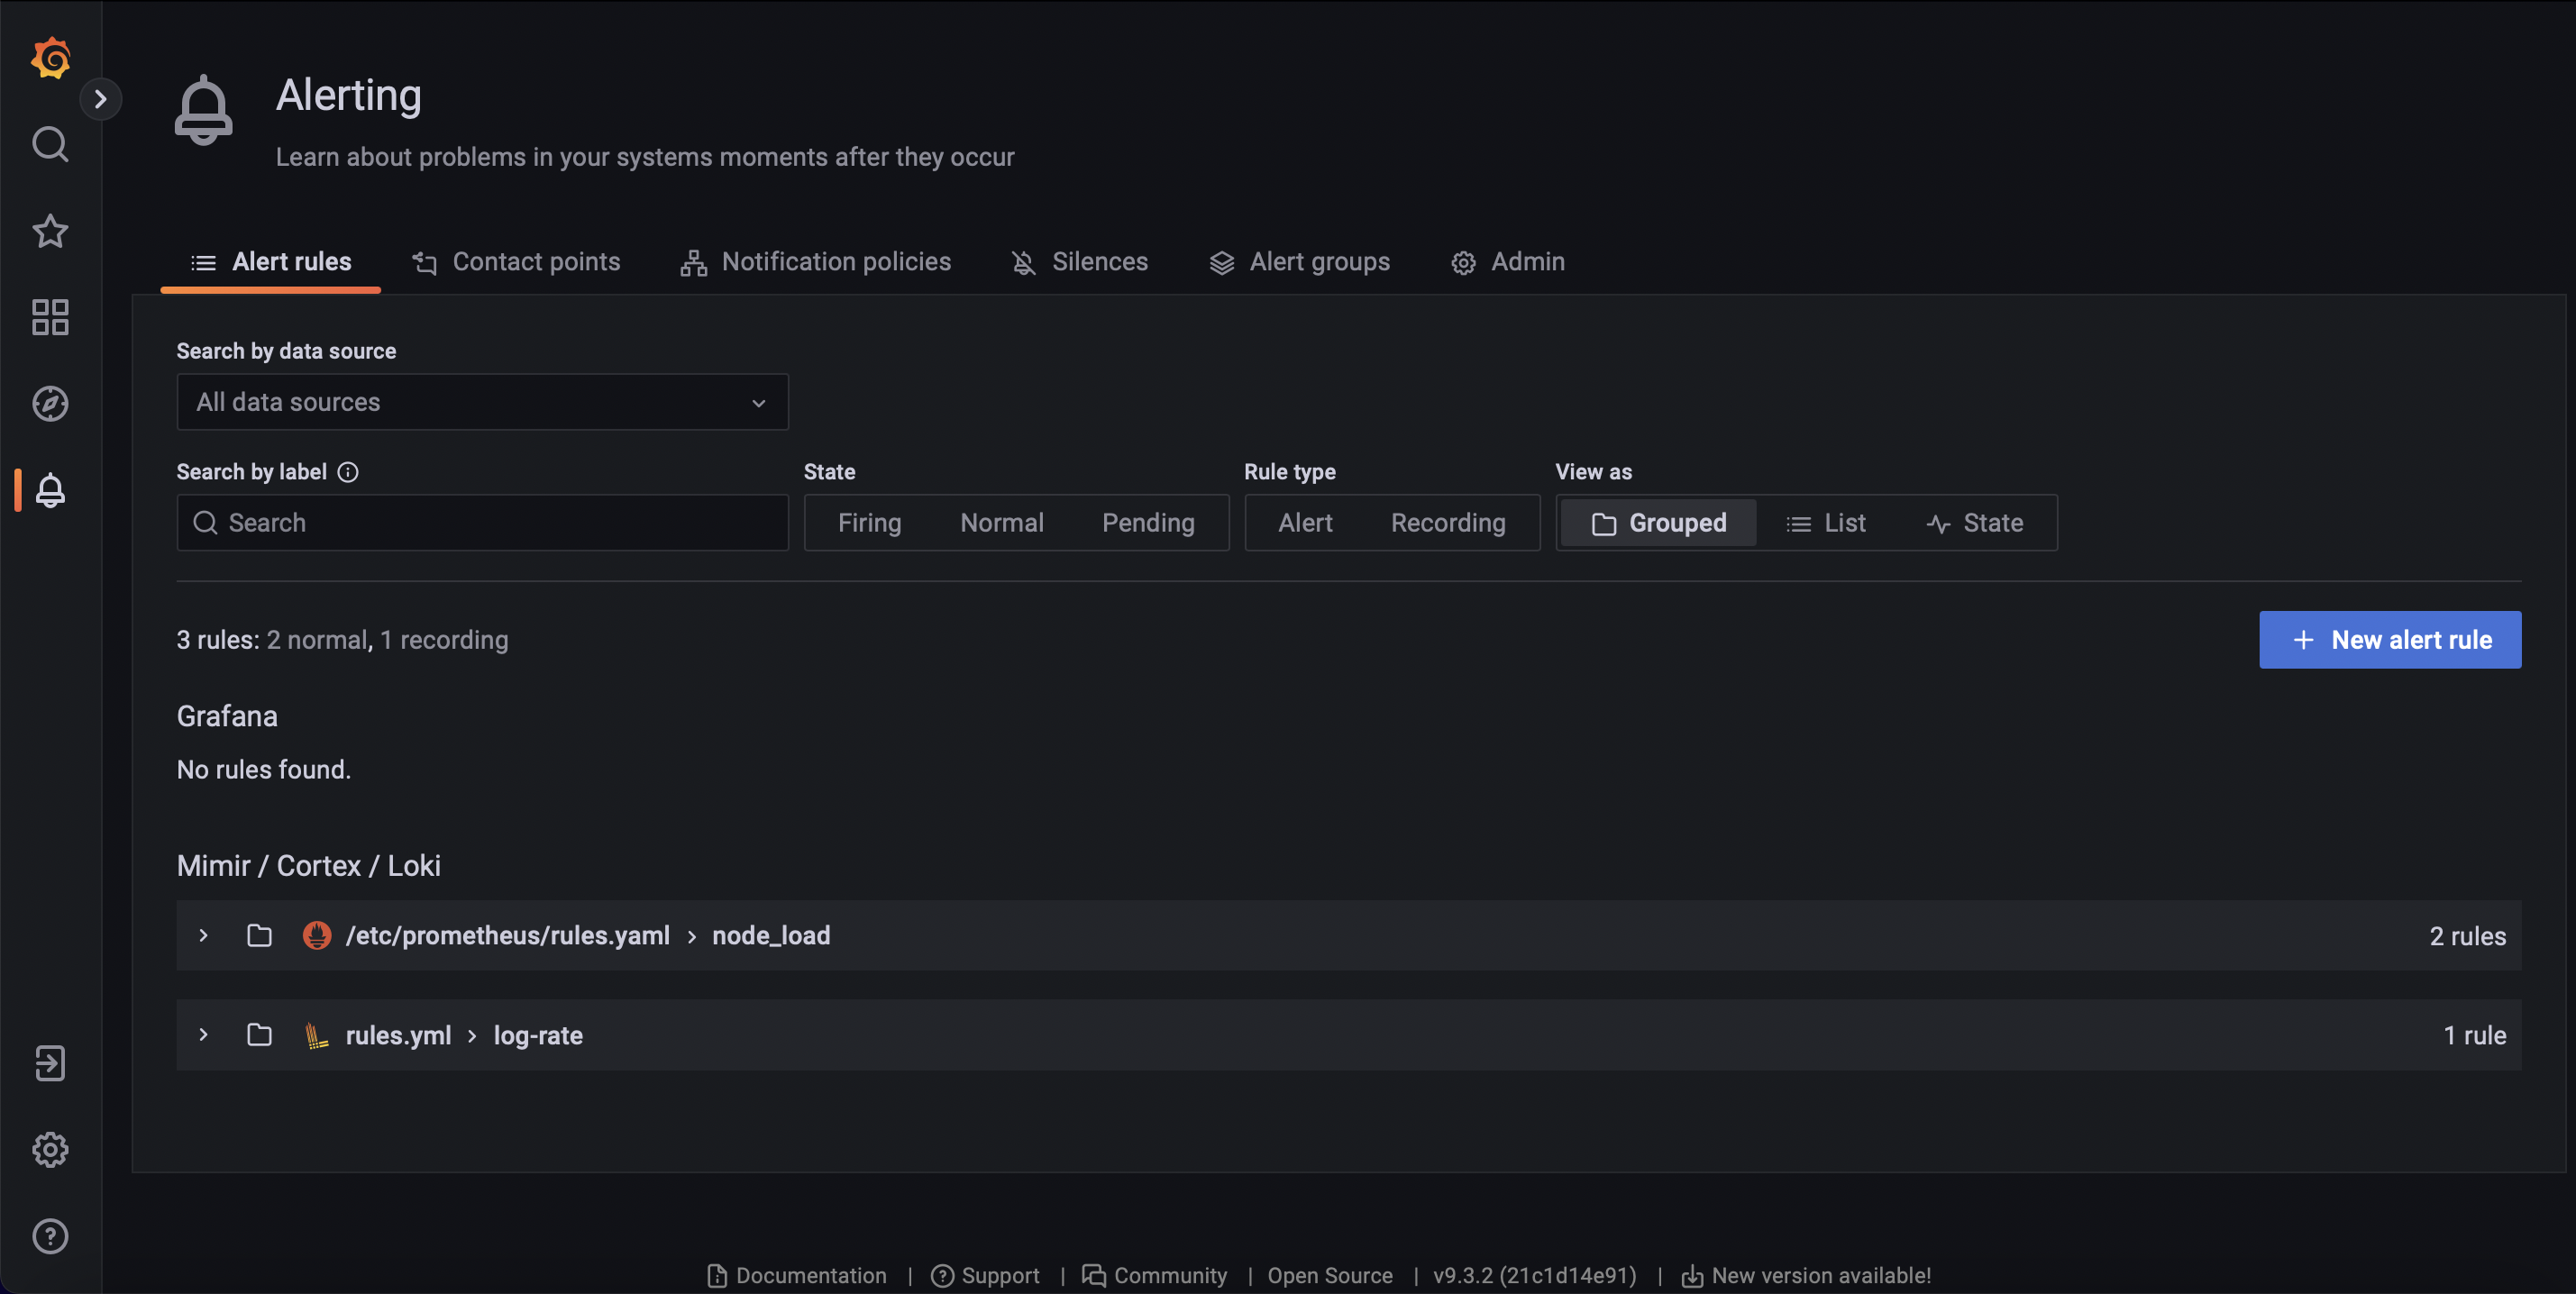

- Like for prometheus, alerts are routed to receivers (like mail) by alertmanager
- how to install loki and promtail on docker https://grafana.com/docs/loki/latest/installation/docker/
- example of alerting rules for logs https://grafana.com/docs/loki/latest/rules/#example