
To download a single executable file navigate to the Release page.
Alternatively, download the source code from the release page or clone the repository to your local machine. Once downloaded, navigate to the project folder and type cmd in the directory to open the command line. Run the setup.py file and download the required dependencies. The Ideal Home Location Matcher.py will initalize the GUI and start the application.
Once the application has started the instructions page will appear with a summary of the steps outlined below.
-
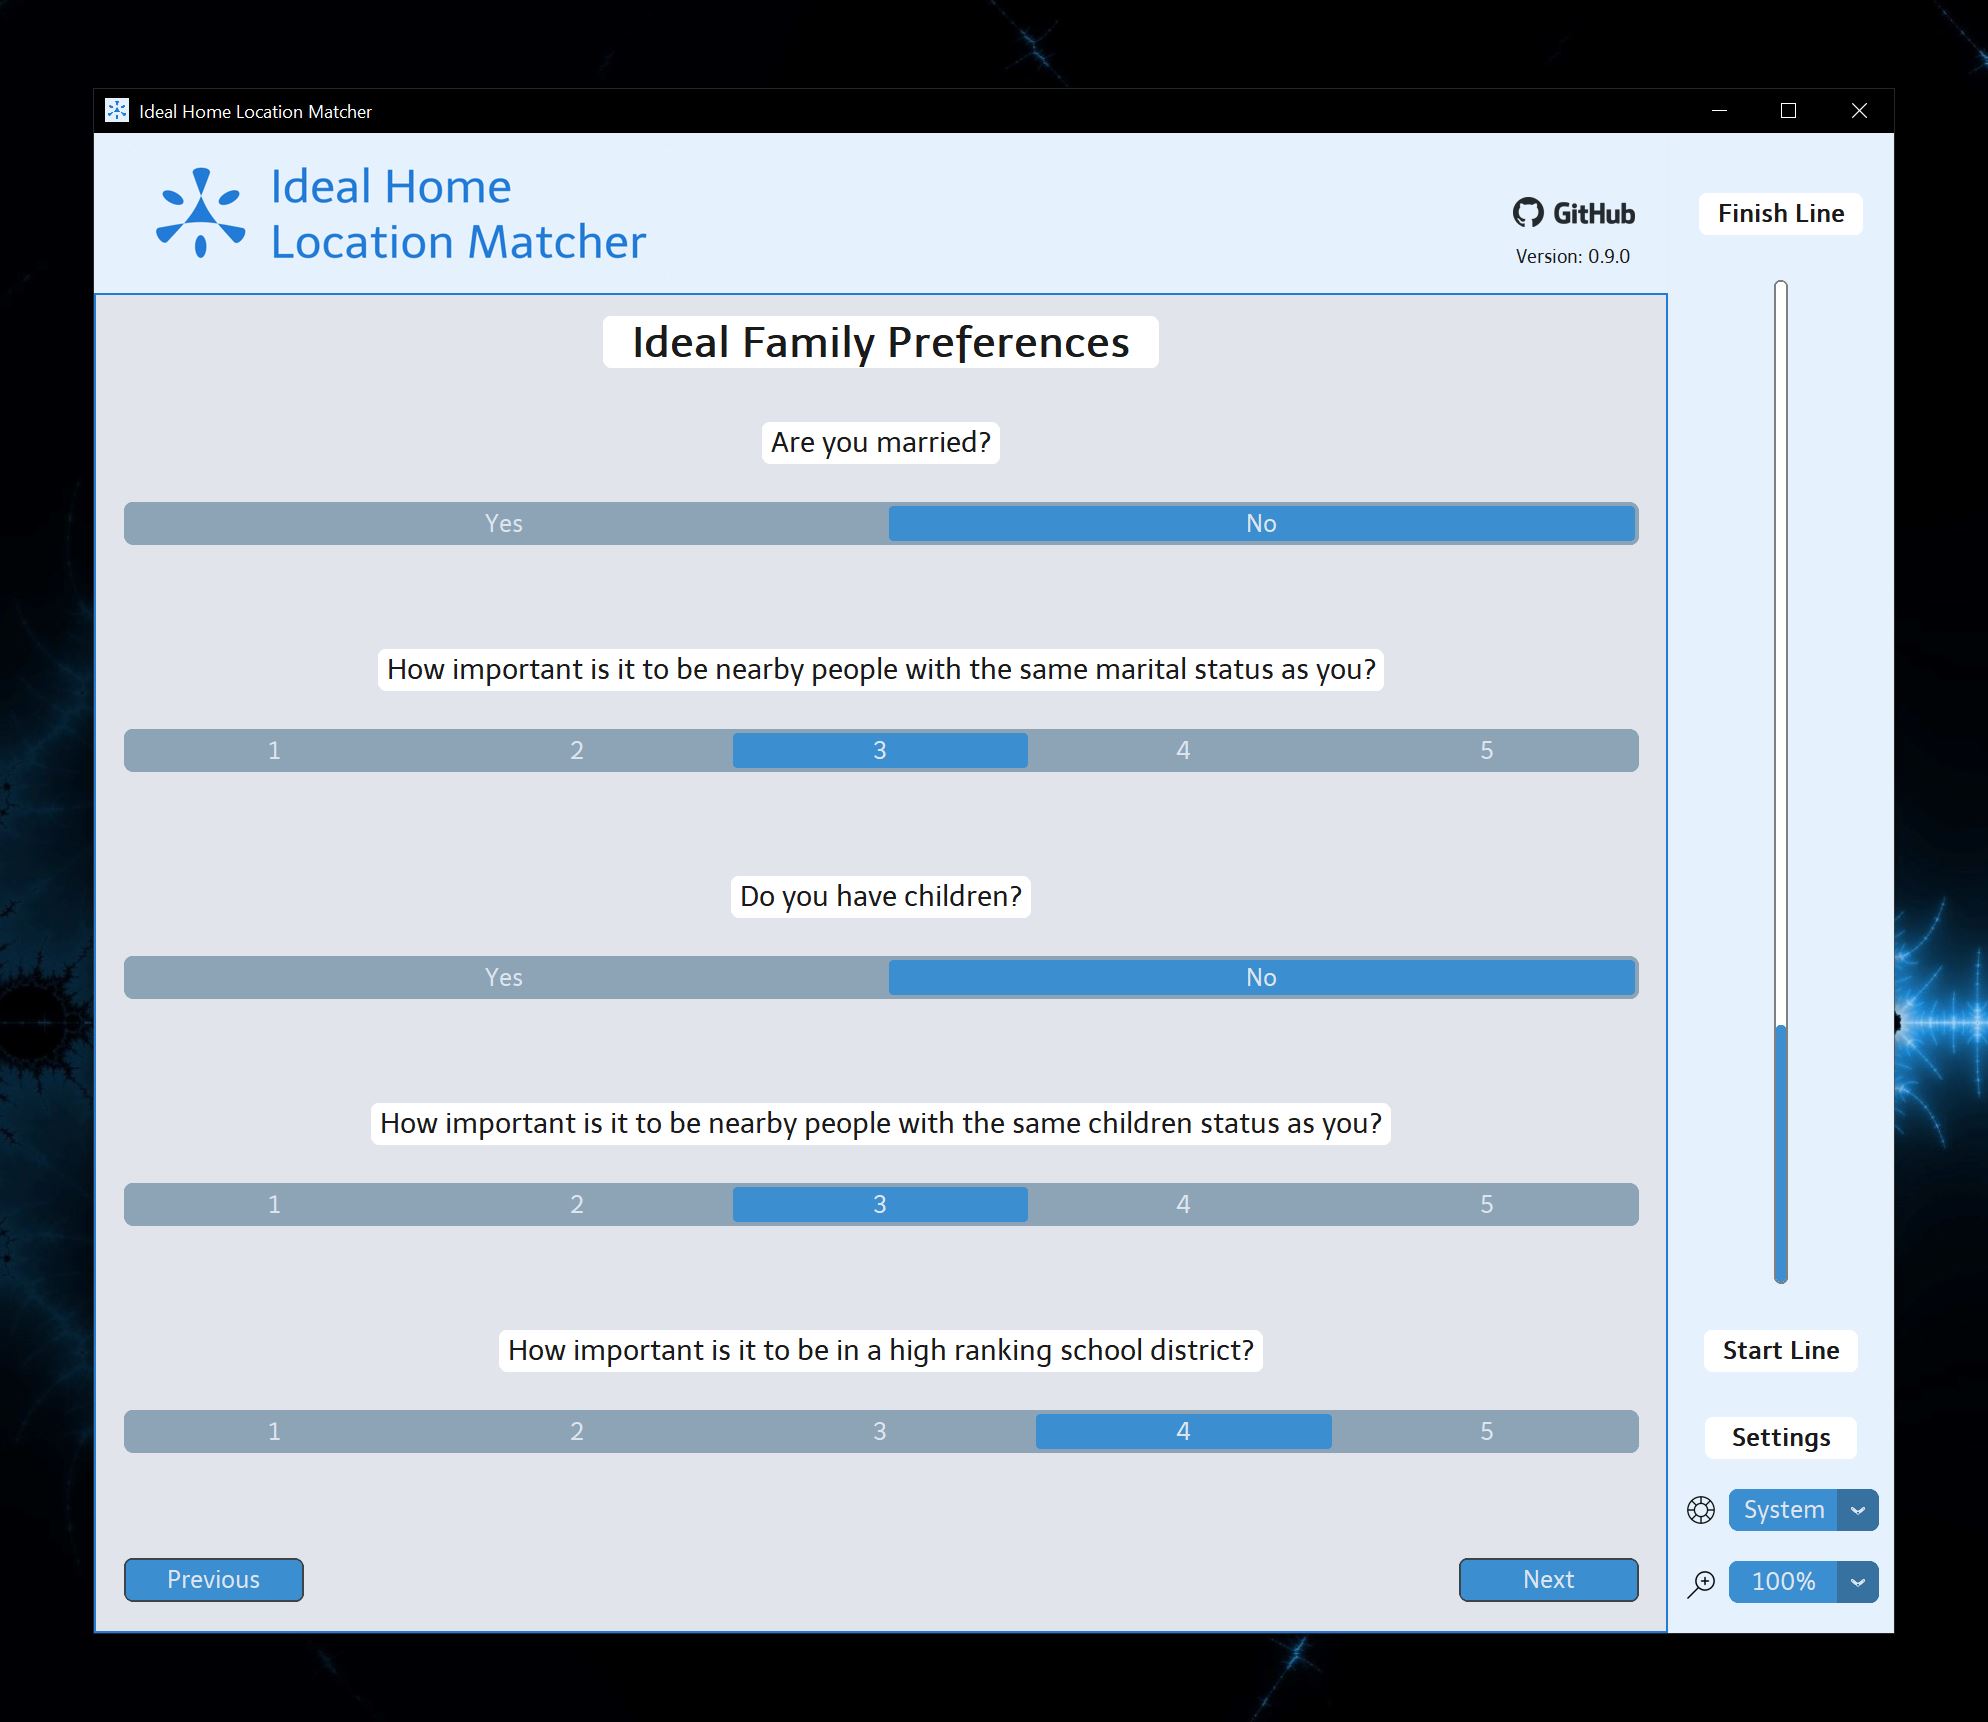
The progress bar on the right hand side will give you an understanding of how much of the information has been completed.
-
The application supports both light mode and dark mode.
-
The zoom percent is shown in the bottom right and can be adjusted for user accessibility.
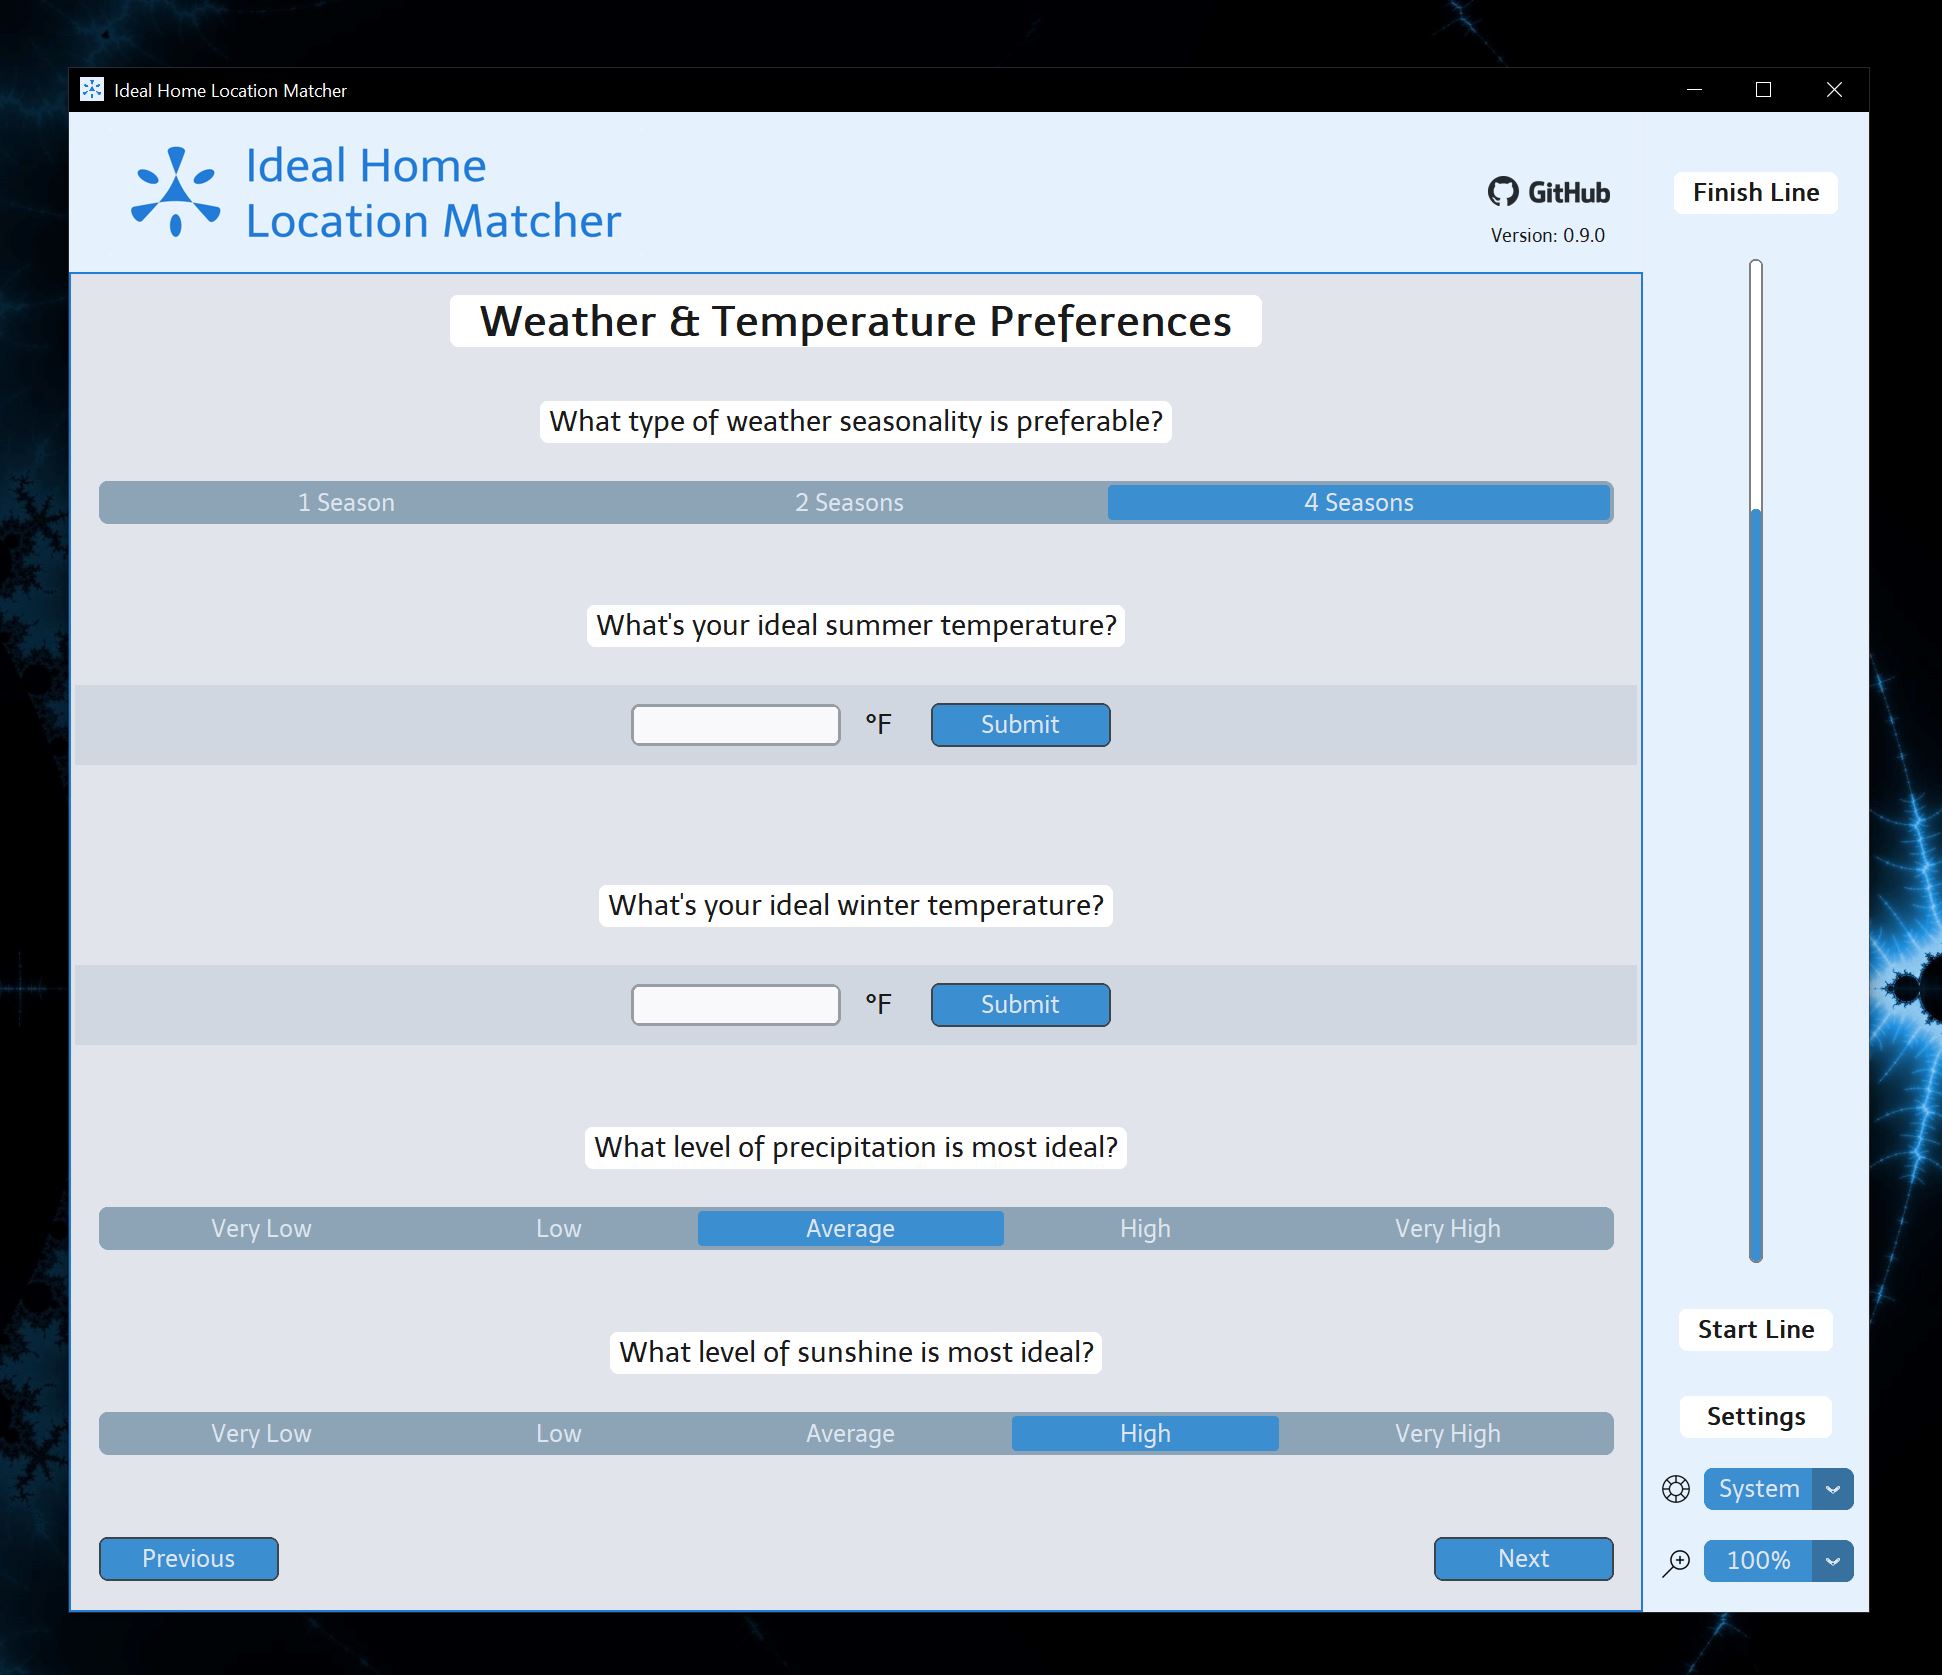
Click the button that closest matches your ideal conditions. Remember that each selection limits your results so choose carefully.
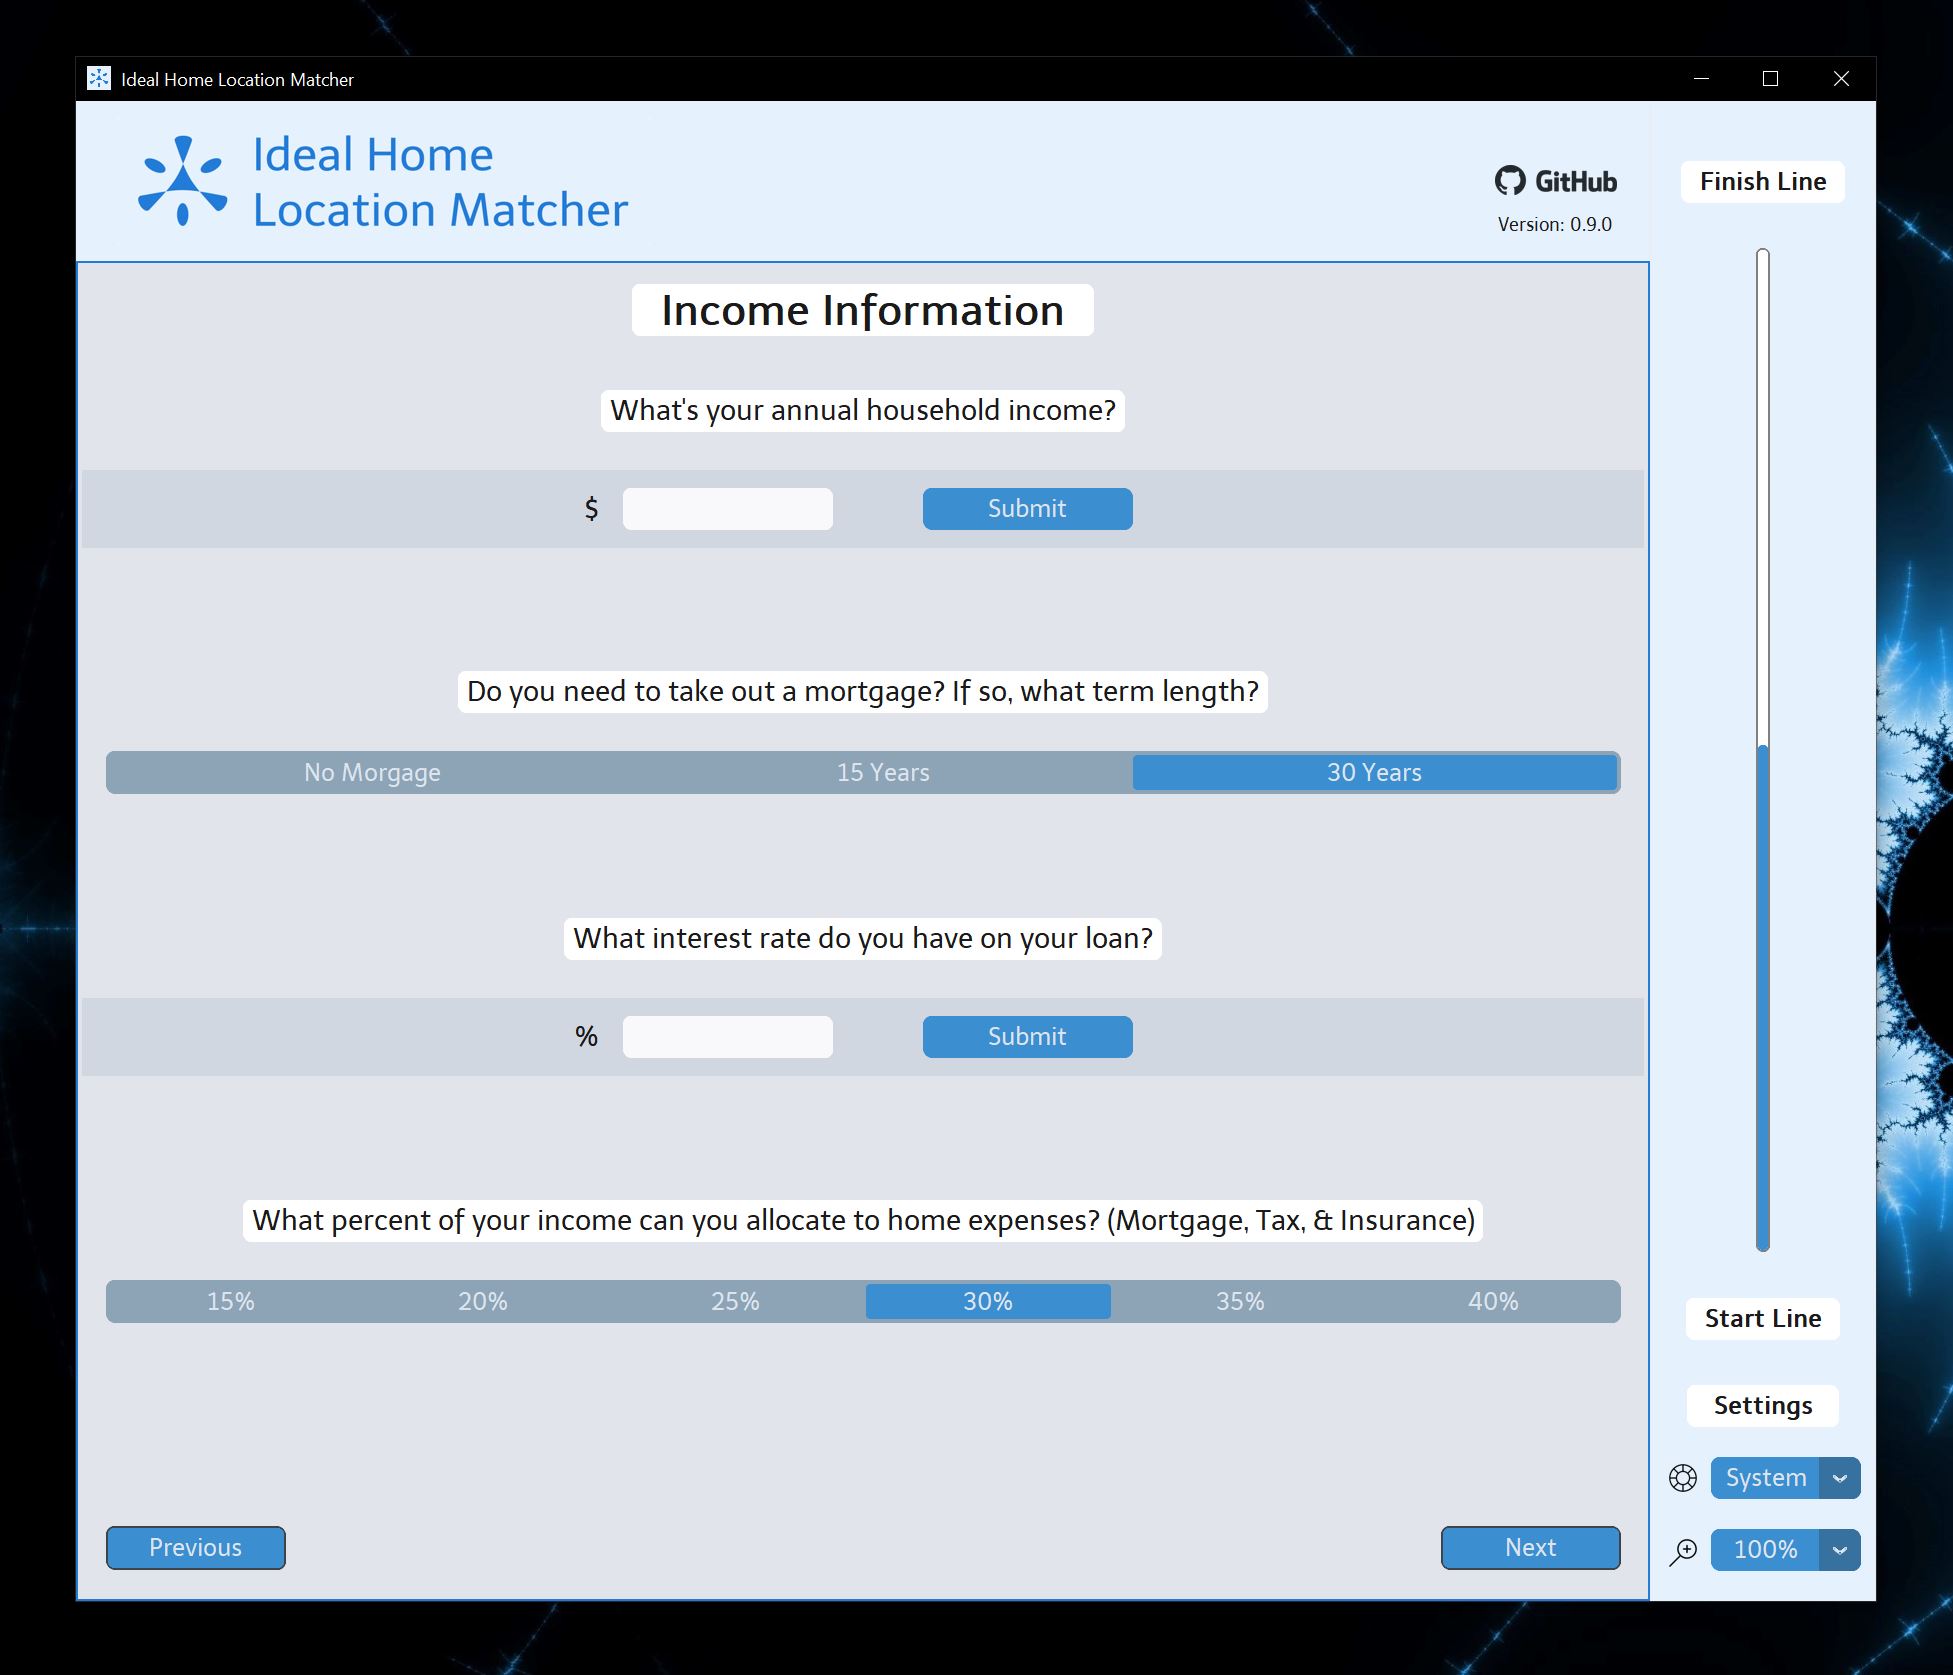
Input your specific information when prompted. Remember that the more accurate the better. The calculator will automatically provide a reasonable margin for each criteria.
Calculate your approximate interest rate based on your credit score. Remember that the interest rates will vary based on current market conditions.
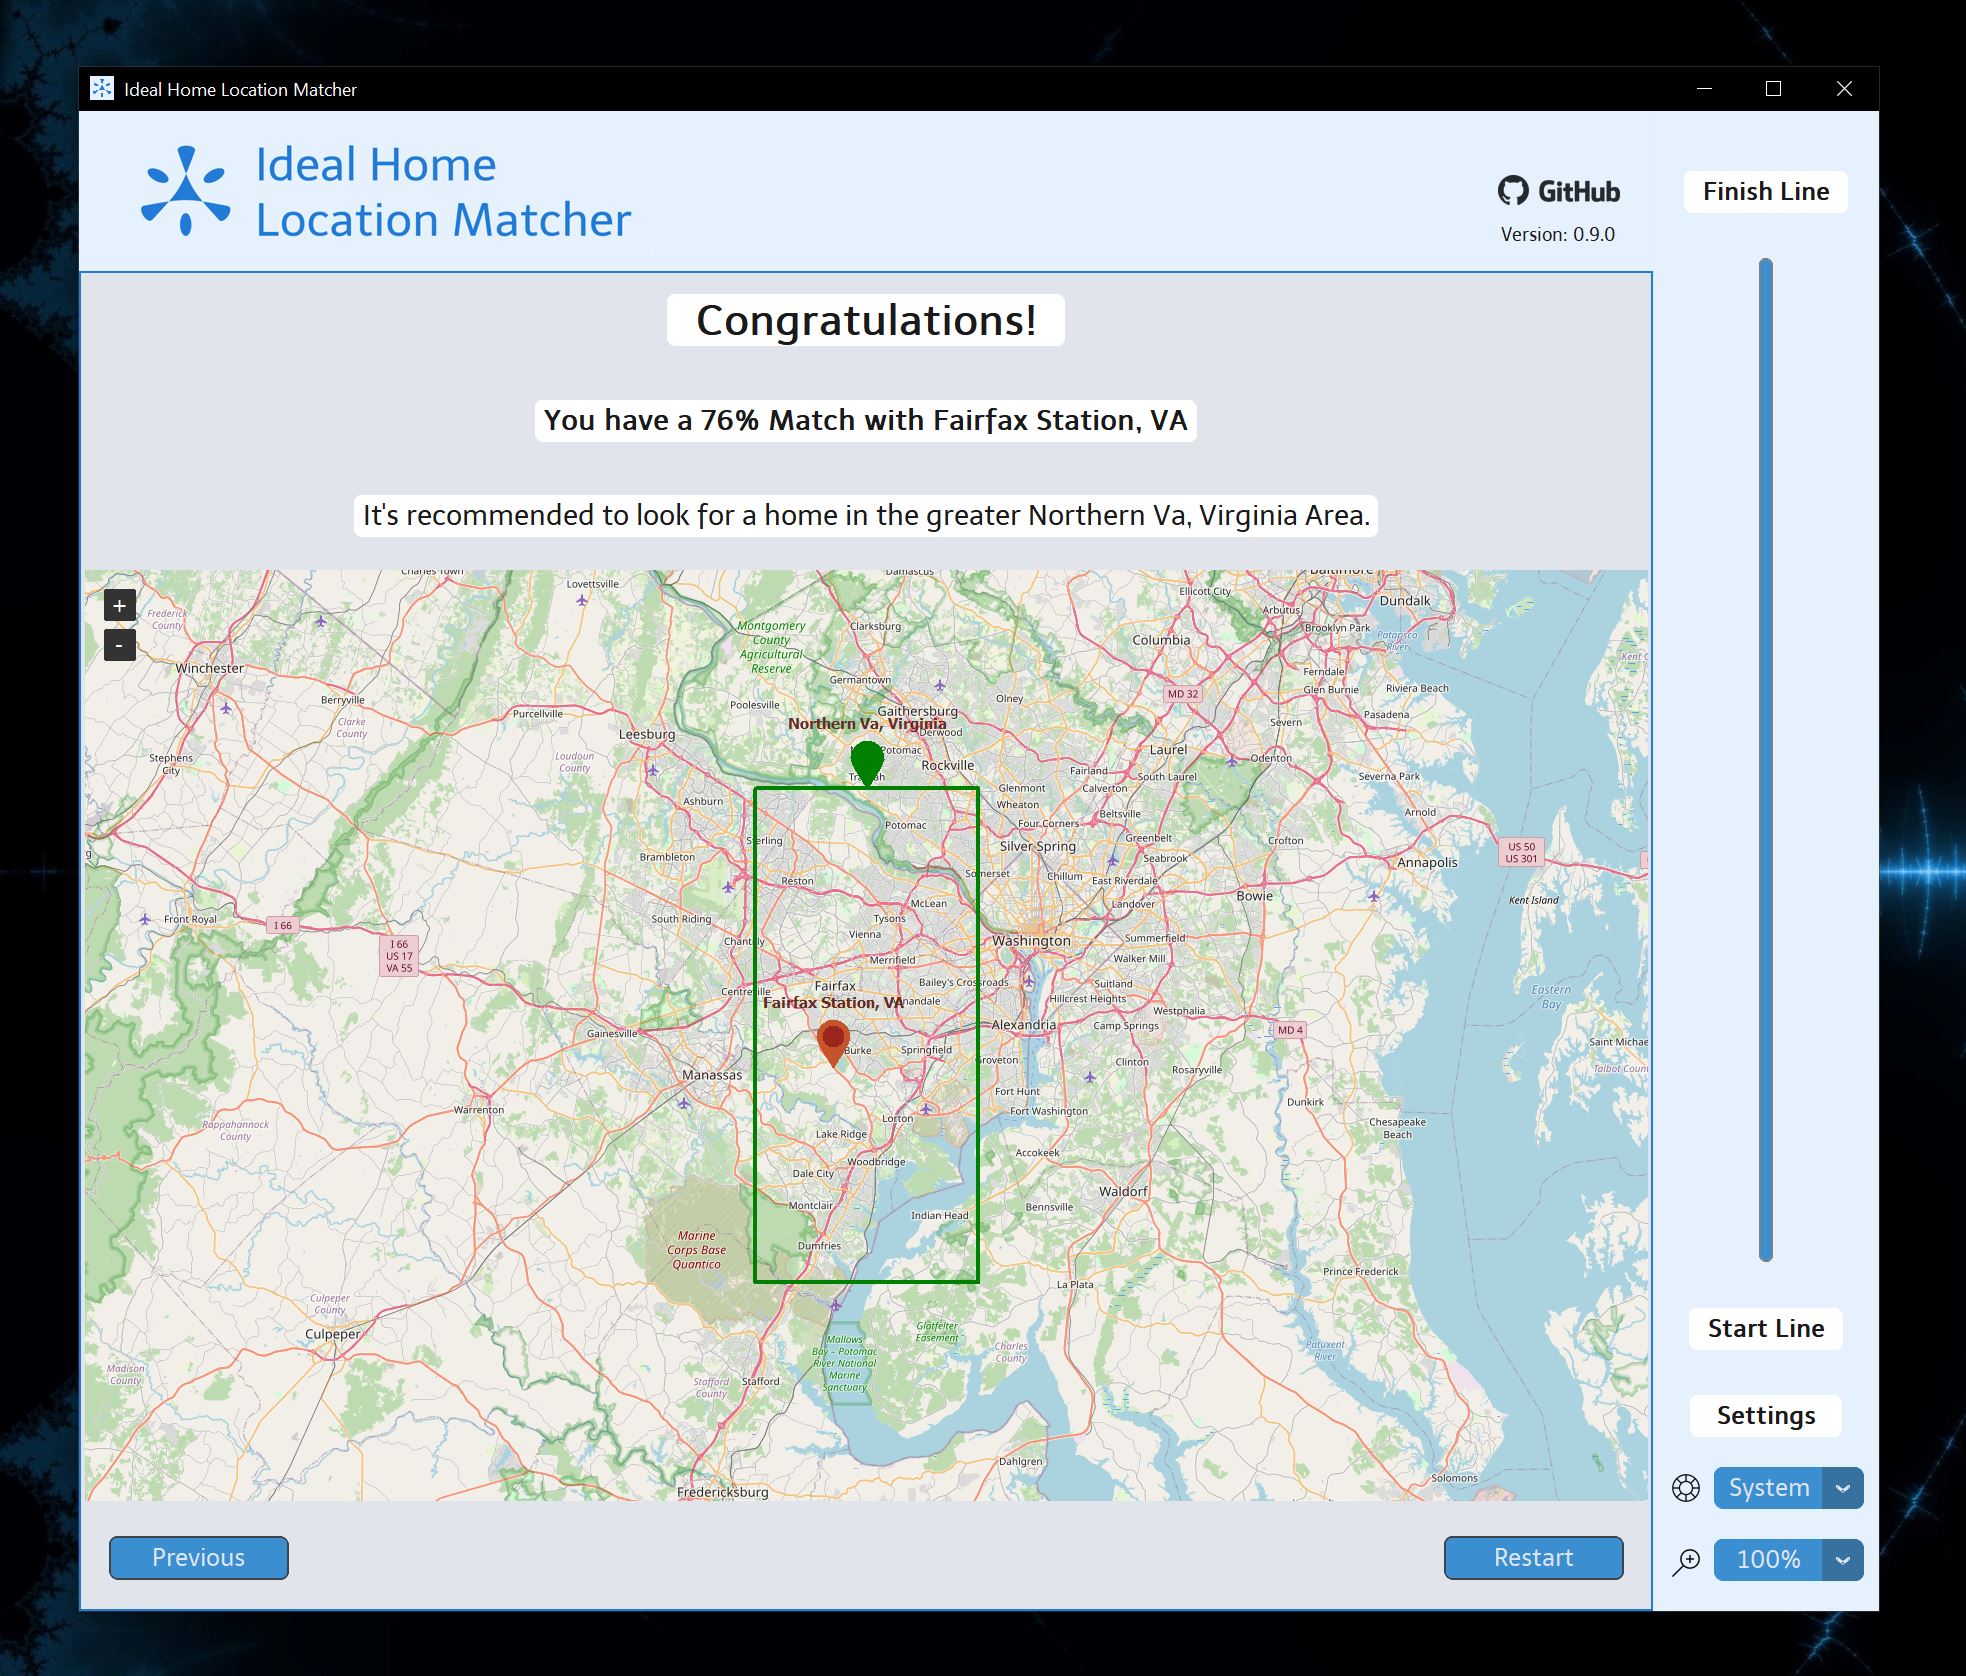
The final result will provide a city and region of the United States. Remember that the map will show the city marked in red and the region marked in green.
The data source folder contains the csv files for the natural disaster events and the USA zipcode prefix codes. The source citation has the information on where to download the files. This folder contains no data processing.
For replicating the results of this repository, copy the natural disaster '.csv' in the project folder. Modifications have been made to how the blizzard / snow storm data has been recorded. The original file shows severe snow storms affecting the southern states and less affect on the northern states. I believe this is based on 'impact' with the northern states being more prepared for winter weather. The implication of avoiding blizzards, based on my understanding, is to avoid the colder climates. This is the rational behind these modifications.
The three main datasets used in the analysis are natural disaster data, weather data, and zipcode census data. The datasets have been scrapped for relevant information and saved in the /data_collection/proccessed_data/{file_name}.json files. This is to reduce runtime CPU overhead and reduce memory footprint.
The natural disaster data from the data sources folder is processed for later data ranking. The data is separated into events on a per state and per disaster type basis. All 50 states, and the District of Columbia, have recorded some type of natural disaster in the last 120 years since the dataset began.
The weather data was fetched from the Meteostat API. The weather data for each city was collected and averaged over the three digit zipcode prefix which the city belonged. This separated the united states into approximately 950 weather zones. The monthly temperature, precipitation, and sunshine levels were collected and then averaged over a period of 30 years.
The zipcode data was gathered by using the uszipcode repository. The data was gathered from US Census website. Unfortunately, the data is mostly from 2016, and this will add some margin of error to the results. Hopefully, in future updates the 2020 census data can be incorporated. This results are representative of over 41,000 US zipcodes. Any data missing for selected zipcode is stored as a null value and disregarded in the final calculation.
The data is ranked for ease of use and to reduce the CPU overhead during runtime. The processed datasets are updated with the ranking and stored in the /data_ranking/ranked_data/{file_name}.json files.
The ranking compares each region of the united states against one another. The method of comparison is based on the skewness of the dataset distribution and the deviation ratio.
The median ranking was used when it was appropriate to find an approximate normal distribution for moderately skewed datasets. All of the values are include in the final analysis, both the left and right tails. The deviation ratio in this case is the measure of how many median absolute deviations a data point is away from the median.
deviation_ratio = (value[x] - Yearly_Median) / Yearly_Median_Absolute_Deviation

rank = 'Well Above Average' if deviation_ratio > 2 else 'Above Average' if 2 >= deviation_ratio > 1 else 'Average' if 1 >= deviation_ratio >= -1 else 'Below Average' if -1 > deviation_ratio >= -2 else 'Well Below Average' The mean ranking was used when it was appropriate to isolate the extreme values for highly skewed datasets. Only the right tail values are included in the final analysis, and the left tail values are disregarded. The deviation ratio in this case is the measure of how many standard deviations a data point is away from the mean.
deviation_ratio = (value[x] - Yearly_Mean) / Yearly_Standard_Deviation

rank = 'Very Good' if deviation_ratio > 2 else 'Good' if 2 >= deviation_ratio > 1 else 'Exceptable' if 1 >= deviation_ratio > 0 else 'Not Exceptable'The scoring system is organized into categories based on order of importance. The most important categories have the highest score value and influence the final result with a higher weighting.
The location search results takes first priority over all other metrics. The location radius selected will limit the results to only show the cities within the radius of the user selected city. If more than one cities is selected the results will be from the center point coordinates between all of the cities.
The affordability of the home and household income is the second most important category. The score is based on how closely the user calculated home price and user input income are to the city median values. The median absolute deviation in the home price and income of the city is used to gauge the relative distance from the median.
The weather selections are the third most important criteria. The seasonality of the region accounts for the majority of the weather score. The next most important factors are the temperature, precipitation, and sunshine scores. These are all based on how closely the matching city meets the user selected values.
The selections with options for importance inputs have a dynamic score based on the user selected numerical value. Any categories without an implied importance need to account for differing personal priorities. To calculate the score, the matching city values are compared to the user selected values, and then they're multiplied by the user selected numerical importance.
The lowest priority scoring metrics are the options without a user selected importance input. These are calculated in a similar method to the dynamic importance selection, with the only difference being no multiplication of a user selected value.
The final result is calculated by using the sum of the city score and the region score. The region score is the average score of all the cities within the region's boundaries. The city with the highest score and the associated final three digit zipcode region are output to the OpenStreetMap and the results page.
- Include FEMA Flood Map Data
- Provide Downloadable Data Sheet with Results
- Review Top 10 Home Location Matches
This software is distributed under the GNU license. Please read LICENSE for information on the software availability and distribution.
Please open an issue of if you have any questions, suggestions, or feedback.
Please submit bug reports, suggestions, and pull requests to the GitHub issue tracker.