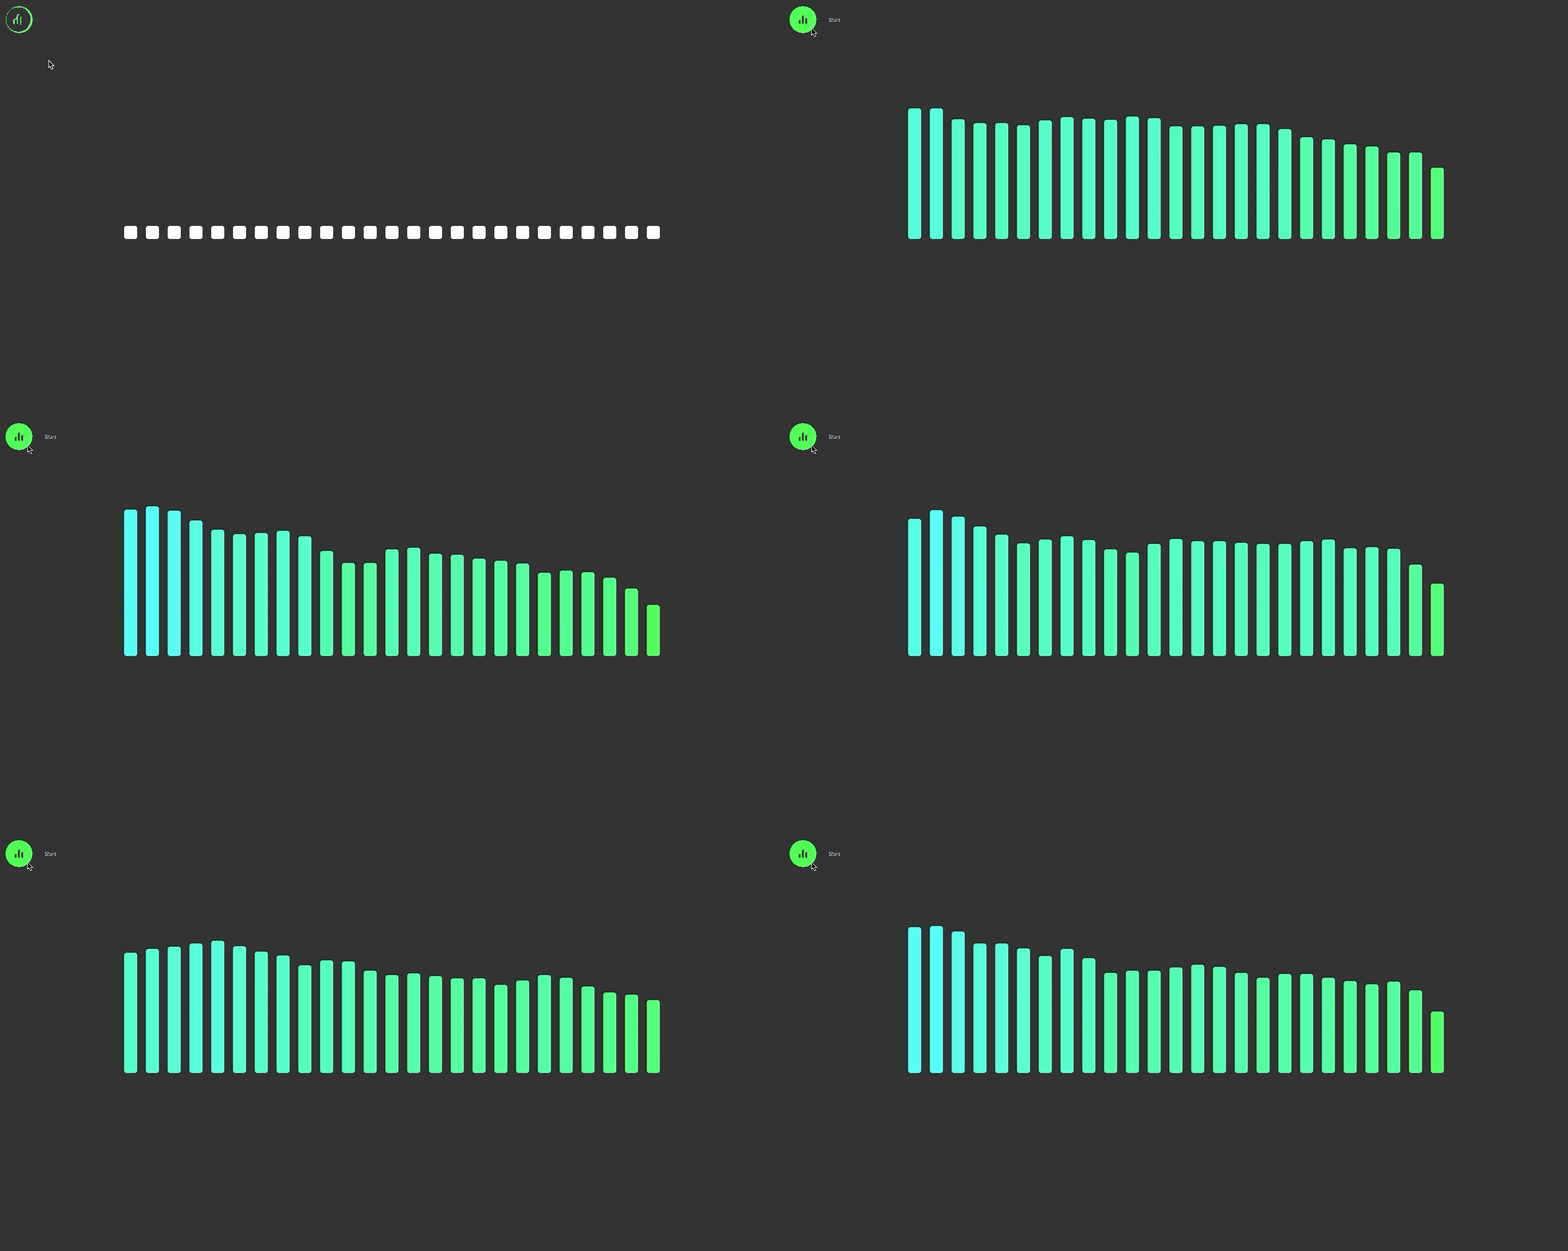
A method for visualizing live spectral data of an audio source in React.js.
Try the Live Demo.
View a more detailed description on Medium
This project utilizes the Web Audio API to create an AnalyserNode for generating real-time frequency analysis information of the audio source in the web browser.
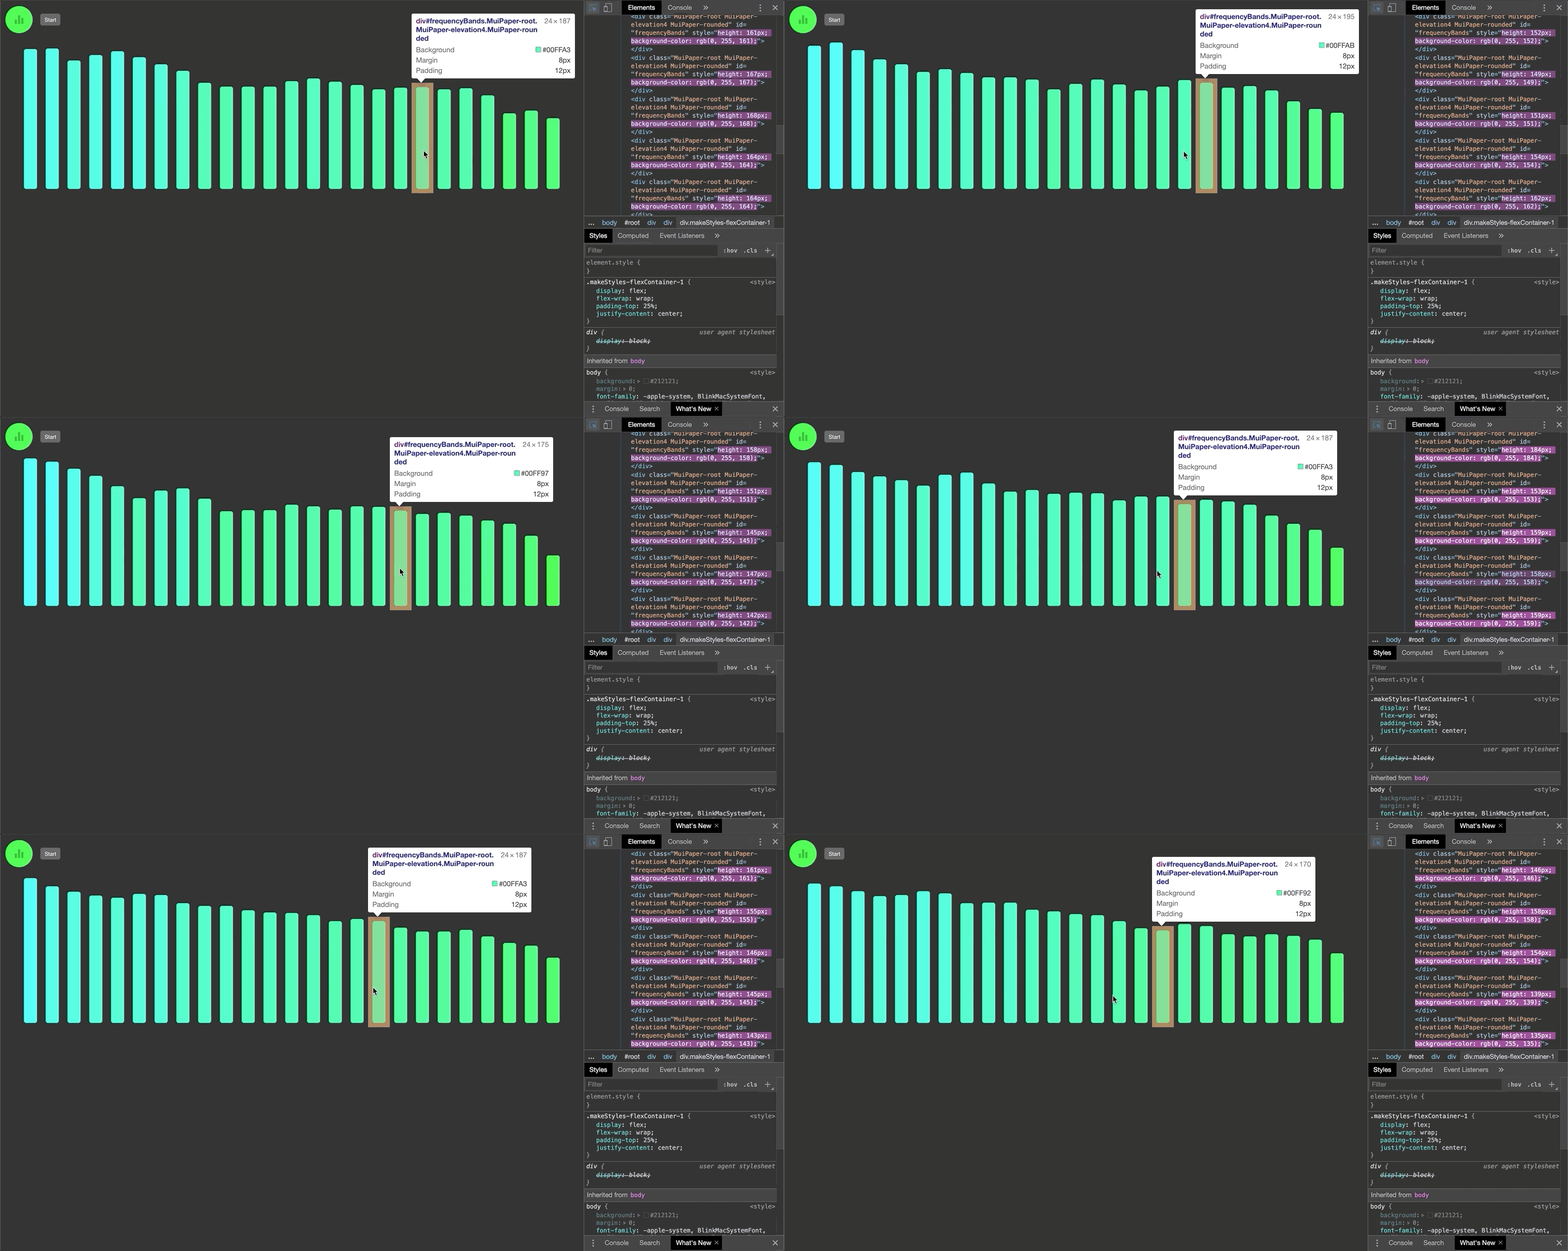
When the Start button is pressed, an audio file is played and a requestAnimationFrame loop is invoked which will retrieve an array of current amplitude values respective to the specified Bin Count. The amplitude values are then passed to Material-UI Paper Components as height properties, and are also used to create RGB values for the backgroundColor of the Paper Components.
The aim of this project is to visualize each frequency band of an audio data source in real time, using components that can be independently styled according to the current amplitude and frequency values.
To demo the project locally, run:
Installs the package dependencies
Runs the app in the development mode.
Open http://localhost:3000 to view it in the browser.


