Example R and Python code to run simulations and analysis in: ‘Letten and Ludington (2023) The ISME Journal’
Install/load R packages.
# devtools::install_github("andrewletten/rescomp")
library(rescomp)
library(reticulate)
library(tidyverse)
library(cowplot)Load existing or generate new growth parameters.
### Number of independent simulations
nsims <- 10 # 100 in paper### With trade-off between mu and Ks
## ----------------------------------
## Read growthparams_S.csv to run sims using exact growth parameters
## presented in paper
growthparams <- as.matrix(read.csv(file = "growthparams_S.csv"))
## Alternatively generate new mu's with:
# growthparams <- matrix(runif(25*nsims, 0.4, 1), nrow = nsims, byrow = TRUE)
## Specify mu and Ks (with tradeoff)
mus <- 0.4*growthparams
kss <- growthparams^4 ### Without trade-off between mu and Ks
## -------------------------------------
## Read growthparams_S.csv and growthparams_Sprime.csv to run sims using exact
## growth parameters presented in paper
# growthparams <- as.matrix(read.csv(file = "growthparams_S.csv"))
# growthparams_prime <- as.matrix(read.csv(file = "growthparams_Sprime.csv"))
## Alternatively generate new Ks' with:
# growthparams_prime <- matrix(runif(25*nsims, 0.4, 1), nrow = nsims, byrow = TRUE)
## Specify mu and Ks (without tradeoff)
# mus <- 0.4*growthparams
# kss <- growthparams_prime^4 ## .csv files have 100 rows / individual parametrisations.
## Optionally (as above) choose `nsims` << 100 (all 100 may take a long time!)
mus <- mus[1:nsims,] Choose simulation length and pulse interval for comparison with outcomes under continuous resource dynamics.
simtime <- 4000
pulseint <- 2 # e.g. either 0.5, 1, 2, 4, 12 or 24Simulate parameterised consumer-resource models under pulsed resource
supply. Note that depending on computing power it may take a fairly long
time (hours if not days) to run 100 sims, especially with more frequent
pulsing. If multiple cores available, consider running sims in parallel
(e.g. with
foreach),
or alternatively reducing the number of sims (nsims) or the total
simulation time (simtime) above.
simpulse <- list()
for(x in 1:nrow(mus)){
  simpulse[[x]] <- spec_rescomp(
    spnum = 5,
    resnum = 5,
    funcresp = "type2",
    mumatrix = matrix(mus[x,],
                      nrow = 5, ncol = 5, byrow = TRUE),
    kmatrix = matrix((kss[x,]),
                     nrow = 5, ncol = 5, byrow = TRUE),
    qmatrix = matrix(rep(0.1, times = 25),
                     nrow = 5, ncol = 5, byrow = TRUE),
    resspeed = 0,
    mort = 0,
    mortpulse = (1-exp(-0.25*pulseint)),
    respulse = 5,
    batchtrans = TRUE,
    pulsefreq = pulseint,
    resconc = c(5,5,5,5,5),
    essential = FALSE,
    totaltime = simtime,
    verbose = FALSE
  ) |> sim_rescomp()
}Simulate parameterised consumer-resource models under continuous resource supply.
simchemo <- list()
for(x in 1:nrow(mus)){
  simchemo[[x]] <- spec_rescomp(
    spnum = 5,
    resnum = 5,
    funcresp = "type2",
    mumatrix = matrix(mus[x,],
                      nrow = 5, ncol = 5, byrow = TRUE),
    kmatrix = matrix((kss[x,]),
                      nrow = 5, ncol = 5, byrow = TRUE),
    qmatrix = matrix(rep(0.1, times = 25),
                      nrow = 5, ncol = 5, byrow = TRUE),
    resspeed = 0.25,
    mort = 0.25,
  #  mortpulse = 0,
  #  respulse = 5,
  #  batchtrans = TRUE,
  #  pulsefreq = 24,
    resconc = c(5,5,5,5,5),
    essential = FALSE,
    totaltime = simtime,
    verbose = FALSE
  ) |> sim_rescomp()
  }
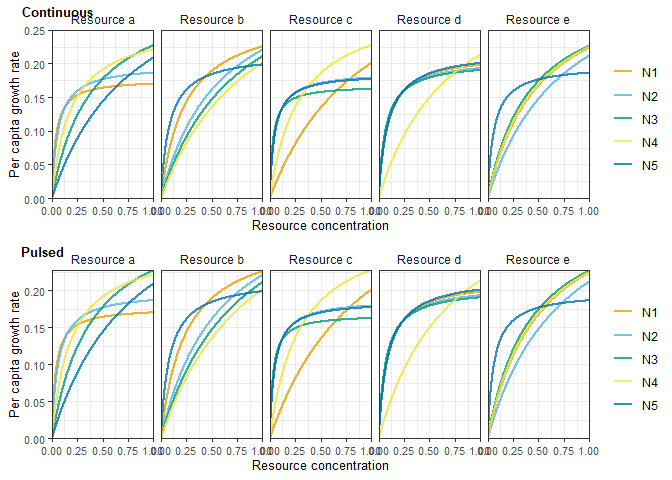
Check functional responses for an individual parameterisation (should be identical for continuous and pulsed resource supply)
simnum <- 1 # parameterisation (any of 1:nsims)plot_grid(
plot_funcresp(simchemo[[simnum]][[2]]),
plot_funcresp(simpulse[[simnum]][[2]]),
nrow = 2,
labels = c("Continuous", "Pulsed"),
label_size = 10,
label_x = c(-0.02, 0)
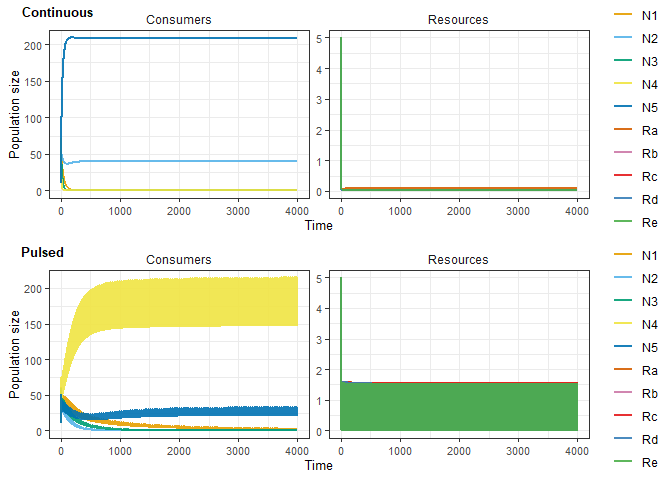
)Plot time series for an individual parameterisation (should not be identical for continuous and pulsed resource supply!)
plot_grid(
  plot_rescomp(simchemo[[simnum]]),
  plot_rescomp(simpulse[[simnum]]),
  nrow = 2,
  labels = c("Continuous", "Pulsed"),
  label_size = 10,
  label_x = c(-0.02, 0)
)samplerange <- ((simtime*10)-100):((simtime*10)+1)
mydf_chemo <- data.frame(simchemo[[simnum]][[1]])[samplerange,]
mydf_pulse <- data.frame(simpulse[[simnum]][[1]])[samplerange,]
chemo_persist <- data.frame(mydf_chemo[,2:6] > 0.01) %>%
pivot_longer(cols = starts_with("X")) %>%
filter(value == TRUE)
pulse_persist <- data.frame(mydf_pulse[,2:6] > 0.01) %>%
pivot_longer(cols = starts_with("X")) %>%
filter(value == TRUE)
percent_overlap <- length(
intersect(unique(pulse_persist$name), unique(chemo_persist$name)))/
length(
unique(c(pulse_persist$name, chemo_persist$name)))Compositional overlap for parameterisation 1:
0.25
percent_overlap = c()
samplerange <- ((simtime*10)-100):((simtime*10)+1)

for (simnum in 1:length(simpulse)){
  mydf_chemo <- data.frame(simchemo[[simnum]][[1]])[samplerange,]
  mydf_pulse <- data.frame(simpulse[[simnum]][[1]])[samplerange,]

  chemo_persist <- data.frame(mydf_chemo[,2:6] > 0.01) %>%
    pivot_longer(cols = starts_with("X")) %>%
    filter(value == TRUE)

  pulse_persist <- data.frame(mydf_pulse[,2:6] > 0.01) %>%
    pivot_longer(cols = starts_with("X")) %>%
    filter(value == TRUE)


  percent_overlap[simnum] <- length(
    intersect(
      unique(pulse_persist$name),
      unique(chemo_persist$name)))/
    length(unique(c(pulse_persist$name, chemo_persist$name)))
}

mytab <- data.frame(table(percent_overlap))
mytab
percent_overlap Freq
1 0 4
2 0.2 1
3 0.25 2
4 0.5 2
5 0.666666666666667 1
Compositional overlap across all parameterisations:
0.2366667
simchemo_numsol <- lapply(simchemo, `[[`, 1)
simchemo_params <- lapply(simchemo, `[[`, 2)
Switch to Python.
import sympy as sm
import numpy as np
import pandas as pd

# Retrieve numerical solutions and sim parameters from R
simchemo_numsol_py = r.simchemo_numsol
simchemo_params_py = r.simchemo_params
d = 0.25
So = 5
q = 0.1

# Define consumer-resource equations
def consumer_eq(cons):
  consnum = int(cons[1]) - 1
  eq = eval(cons)*((mus[0,consnum,0]*r1)/(kss[0,consnum,0] + r1) +
  (mus[0,consnum,1]*r2)/(kss[0,consnum,1] + r2) +
  (mus[0,consnum,2]*r3)/(kss[0,consnum,2] + r3) +
  (mus[0,consnum,3]*r4)/(kss[0,consnum,3] + r4) +
  (mus[0,consnum,4]*r5)/(kss[0,consnum,4] + r5) - d)
  return eq

def resource_eq(res):
  resnum = int(res[1]) - 1
  eq = (d*(So - eval(res)) -
    n1*q*(mus[0,0,resnum]*eval(res))/(kss[0,0,resnum] + eval(res)) -
    n2*q*(mus[0,1,resnum]*eval(res))/(kss[0,1,resnum] + eval(res)) -
    n3*q*(mus[0,2,resnum]*eval(res))/(kss[0,2,resnum] + eval(res)) -
    n4*q*(mus[0,3,resnum]*eval(res))/(kss[0,3,resnum] + eval(res)) -
    n5*q*(mus[0,4,resnum]*eval(res))/(kss[0,4,resnum] + eval(res)))
  return eq

# Evaluate Jacobian at numerical solution
eigen_list = []
for i in range(int(r.nsims)):
#  print("Running analysis on Sim", str(i), flush = True)
  resultpd = pd.DataFrame(simchemo_numsol_py[i])
  mus = np.array(simchemo_params_py[i]["mu"])
  kss = np.array(simchemo_params_py[i]["Ks"])
  n1, n2, n3, n4, n5, r1, r2, r3, r4, r5 = sm.symbols(
    'n1, n2, n3, n4, n5, r1, r2, r3, r4, r5',
    negative=False)

  N1 = consumer_eq("n1")
  N2 = consumer_eq("n2")
  N3 = consumer_eq("n3")
  N4 = consumer_eq("n4")
  N5 = consumer_eq("n5")

  R1 = resource_eq("r1")
  R2 = resource_eq("r2")
  R3 = resource_eq("r3")
  R4 = resource_eq("r4")
  R5 = resource_eq("r5")

  eqMat = sm.Matrix([ N1, N2, N3, N4, N5, R1, R2, R3, R4, R5 ])
  Mat = sm.Matrix([ n1, n2, n3, n4, n5, r1, r2, r3, r4, r5 ])
  jacMat = eqMat.jacobian(Mat)

  eqmat = jacMat.subs([(n1, resultpd.iloc[-1:, 1].values[0]),
                       (n2, resultpd.iloc[-1:, 2].values[0]),
                       (n3, resultpd.iloc[-1:, 3].values[0]),
                       (n4, resultpd.iloc[-1:, 4].values[0]),
                       (n5, resultpd.iloc[-1:, 5].values[0]),
                       (r1, resultpd.iloc[-1:, 6].values[0]),
                       (r2, resultpd.iloc[-1:, 7].values[0]),
                       (r3, resultpd.iloc[-1:, 8].values[0]),
                       (r4, resultpd.iloc[-1:, 9].values[0]),
                       (r5, resultpd.iloc[-1:, 10].values[0])])

  eigen_real = [float(sm.re(x)) for x in list(eqmat.eigenvals().keys())]
  eigen_list.append(sorted(eigen_real, reverse = True)[0])

eigendat = pd.DataFrame({"eigenvalues": eigen_list, "sim": range(int(r.nsims))})
#print(eigendat)
Plot histogram of eigenvalues.
ggplot(py$eigendat, aes(eigenvalues)) + geom_histogram(bins = 10)

