This PHP script generates a bar chart representing the file sizes and total clusters used by files in a specified directory. The chart helps visualize the distribution of file sizes and cluster usage based on different cluster sizes.
This was written to solve the tuning dilema of which cluster size to choose for a new drive.
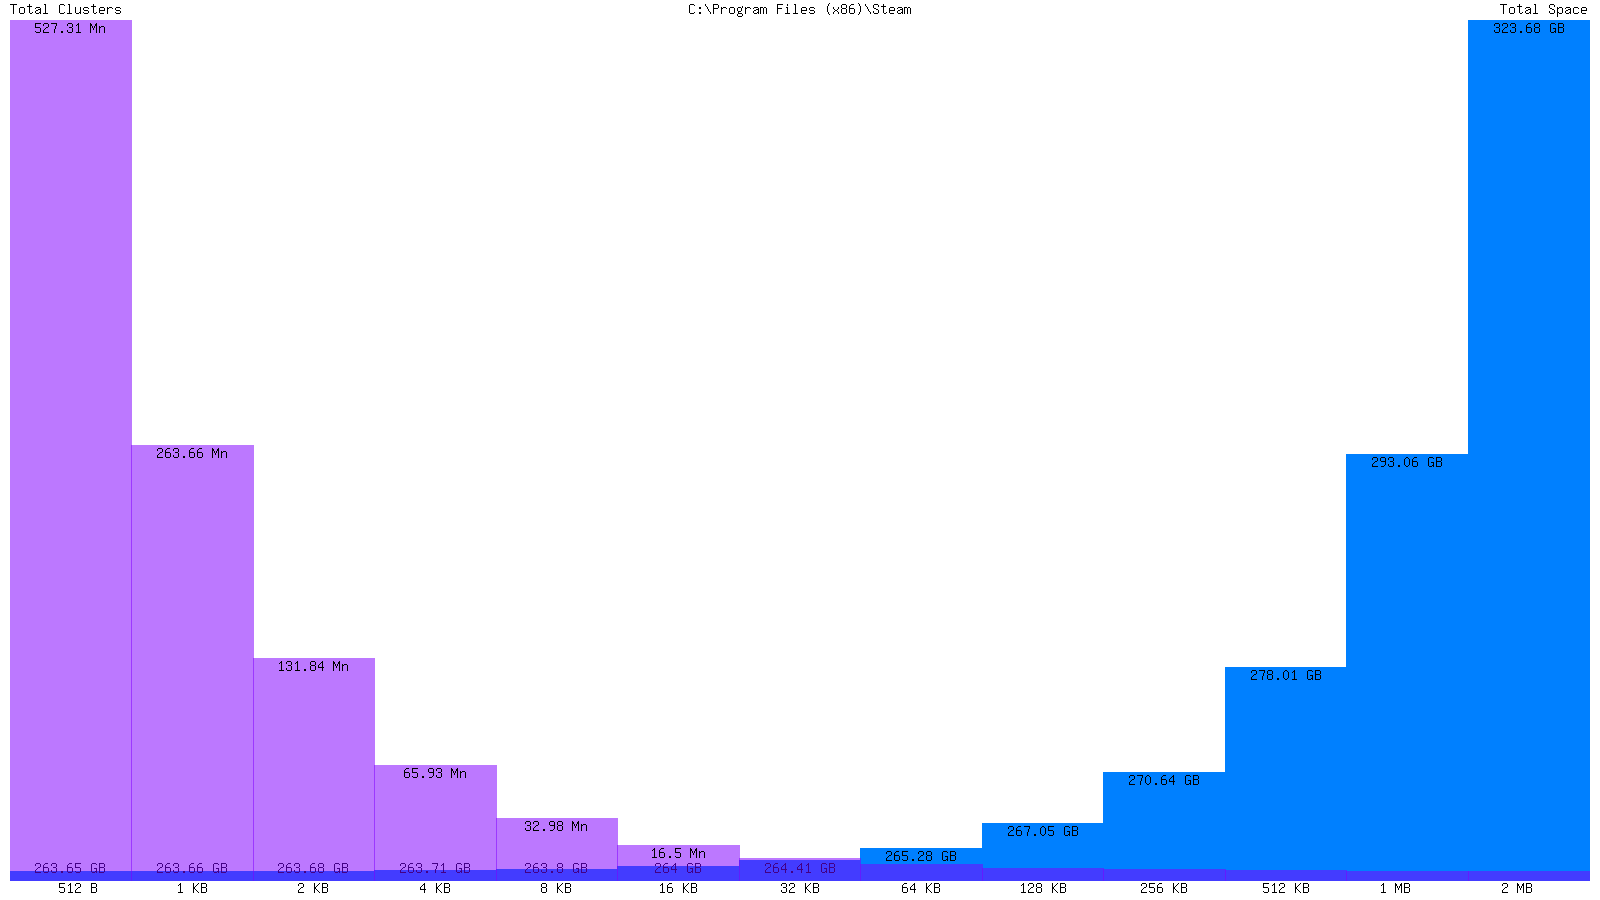
The output of the script is a chart similar to this.
Simply put, it calculates the number of clusters (purple) and the amount of space (blue) that would be consumed for a specific directory for each of the cluster sizes.
In the example above 32 million clusters of size 8192 would consume 263GB and that would be a balance between speed and space. As I want my games to load faster I accept the additional 6GB of space and choose 256KB cluster size.
- PHP 5.6 or above
- Clone or download the script to your local machine.
- Open the script in a text editor.
- Set the desired cluster sizes in the
$clusterSizesarray. Each element represents a cluster size in bytes. The script will calculate the file sizes and total clusters used for each cluster size. - Specify the directory you want to scan by assigning the path to the
$directoryvariable. Ensure that the directory path is valid and accessible. - Save the script.
To generate the chart, run the PHP script from the command line or a web server that supports PHP. The chart will be displayed in the browser as a PNG image.
You can customize the dimensions of the chart by modifying the following variables in the drawChart function:
$width: Specifies the width of the chart image in pixels. $height: Specifies the height of the chart image in pixels.
You can customize the colors used in the chart by modifying the following variables in the drawChart function:
$backgroundColor: Specifies the background color of the chart. $barColor1: Specifies the color of the file size bars. $barColor2: Specifies the color of the total cluster bars. $textColor: Specifies the color of the text labels.
You can customize the formatting of the labels displayed on the chart by modifying the following functions:
formatBytes($bytes): Formats the file size labels. Modify this function to change the formatting of the file size labels, e.g., adding a different unit or changing the decimal precision.
formatNums($number): Formats the total cluster labels. Modify this function to change the formatting of the total cluster labels, e.g., adding a different unit or changing the decimal precision. Additional Customization
You can further customize the script as per your requirements, such as modifying the chart layout, adding legends, or changing the directory scanning logic.
This script is released under the MIT License.

