A cross-platform S-parameter Viewer written in Python.
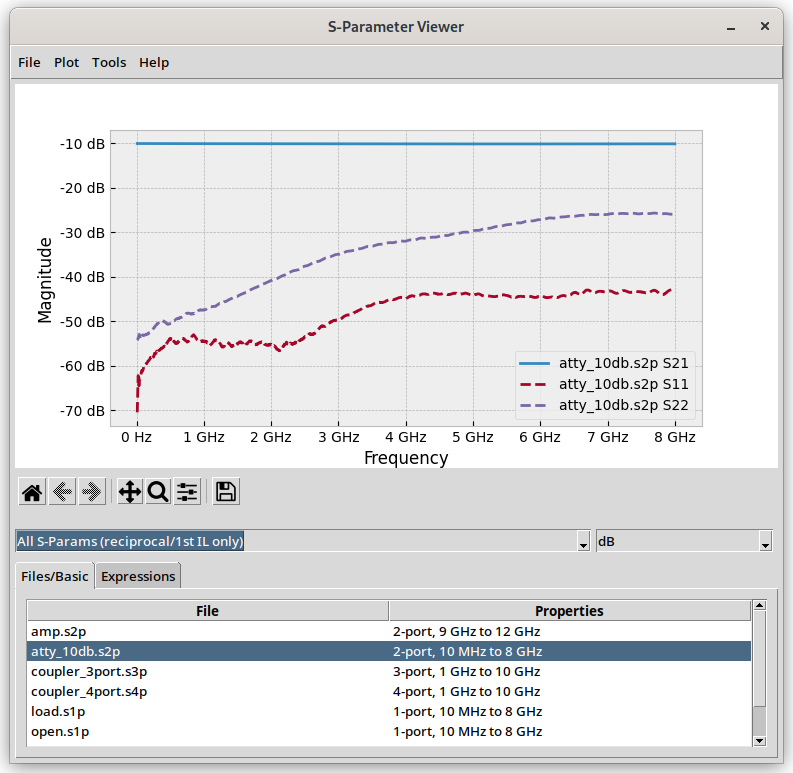
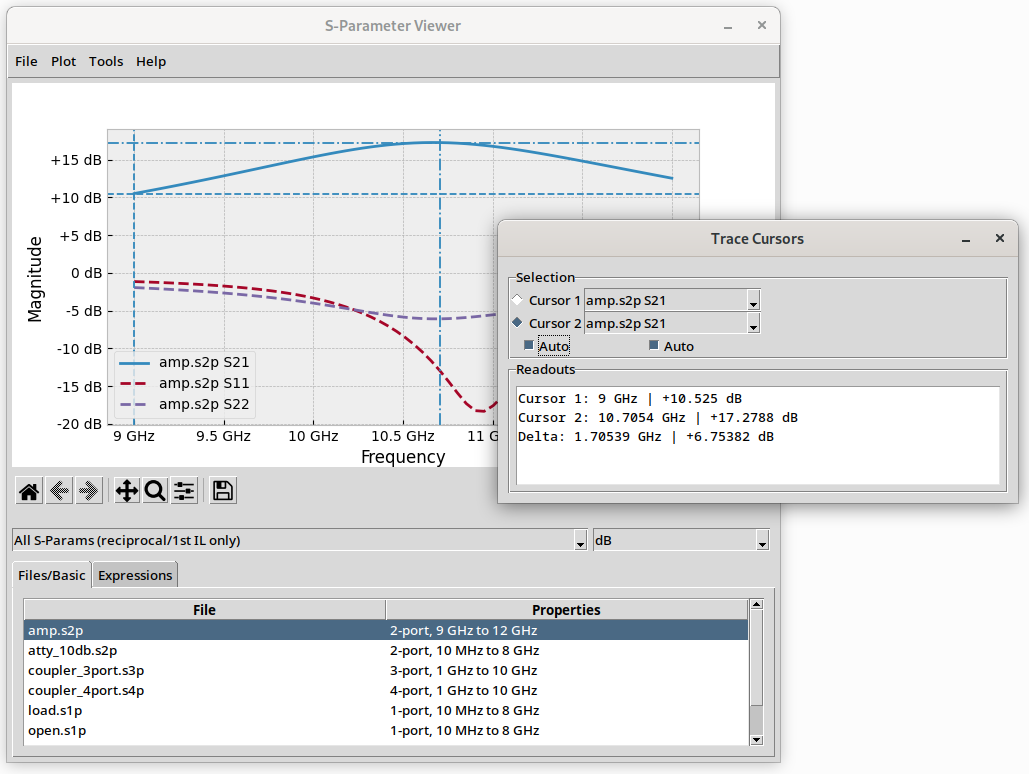
- Various flexible ways of displaying S-parameters, e.g. IL (all/reciprocal) only / RL only, linear/dB/Smith-chart/re-im, impulse/step response, Phase (normal/unwrapped), Group Delay
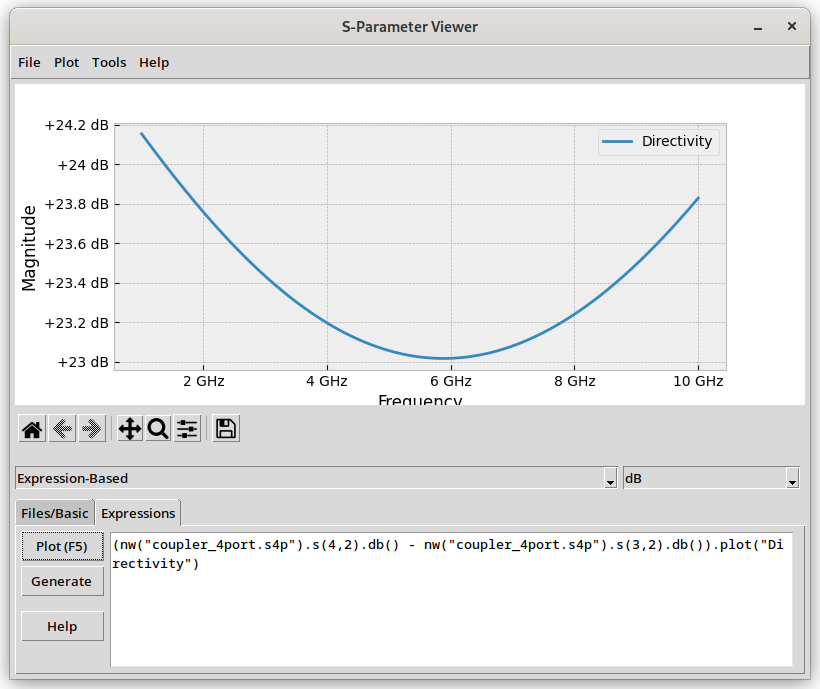
- Plotting of Python-based expressions, including functions for stability factors and stability circles, for adding passive elements, checking for passivity/reciprocity/losslessness, and for Bode-Fano optimum RL estimation
- to learn more about this feature, open the "Expressions" tab, and click "Help"
- Export to CSV or XLSX
- Python 3.12 (might work with 3.7 or newer, but not tested)
- Packet dependencies:
numpy scipy scikit-rf matplotlib tk pygubu openpyxl appdirs pillow pandas CITIfile- Under Feodora Linux, you may have to install
python3-pillow-tkviadnf
- Under Feodora Linux, you may have to install
- Optional packet dependencies:
pyinstaller: to compile a binarypywin32: to copy plot image to clipboard (Windows only)
- you can just start the app (execute the Python script) and load a directory
- optional: compile the Python script (see instructions below)
- or you can open one or more file with the app
Compiling is optional. You can just as well run the Python script.
Compiling was successfully tested under Windows 10 and under Fedora 37 with the following command:
cd srcpyinstaller pyinstaller.spec- clean build without overwrite-confirmations:
pyinstaller --noconfirm --clean pyinstaller.spec
- clean build without overwrite-confirmations:
Under Fedora 37 at least, I had to fix matplitlib by coping the contents of src/dist/sparamviewer/matplotlib/mpl-data/ to share/matplotlib/mpl-data/.
To register S-parameter files with this application under Linux:
- Register a mime-type for S-parameter files using
res/application-x-scatteringparameter.xml(for instructions, see e.g. https://help.gnome.org/admin/system-admin-guide/stable/mime-types-custom-user.html). - Double-click any .s#p-file, and select the script
src/sparamviewer.py(or the binary, if you compiled it) as the application.
To register S-parameter files with this application under Windows:
- If you compiled the script (see instructions above): just Double-click any .s#p-file, and select
src/dist/sparamviewer/sparamviewer.exeas the application. - If you want to run the script directly without compiling:
- Open
res/sparamviewer.batin a text editor. - Adapt the paths to your Python interpreter, as well as the path where
src/sparamviewer.pyis, in the 1st line. - Double-click any .s#p-file, and select the batch-file
res/sparamviewer.batas the application .
- Open
Uou have to repeat this step for every type of .s#p-file, e.g. .s1p, .s2p, ...
- Display: more presets, to quickly scroll through all S-parameters
- Add transformations in GUI: TDR, Z, Y, H, ABCD, Reciprocity, Passivity, Losslessness
- The idea is that the GUI has 3 steps: transform -> select parameter -> plot format
- The plot format for step/impulse response would have to be changed to a transformation
- Allow user to select between generic and file-specific generated expressions
- Equation-based plot type
- Log output for equations (so that you can also print some data or status)
- Allow to provide regex to strip names in expression plots
- File type registration script for Windows (using
assocandftype)
- Under Fedora Linux, Gnome freezes when you open a non-Touchstone file, then open the same file again with a proper viewer reason unknown
To modify the UI, you need pygubu-designer 0.39.
There are sample .json-files in the res folder for VS Code.


