The goal of vizoR is to provide helper functions to help designing better visualizations in R.
This package is under active developpement. You can install it from github:
devtools::install_github("aneuraz/vizoR")Retrieving a color palette from color-hex.com (by number)
library(vizoR)

pal5361 <- color_hex_palette_from_number(5361)
pal5361
#> [1] "#ffb3ba" "#ffdfba" "#ffffba" "#baffc9" "#bae1ff"show_pal(pal5361)Retrieving a color palette from color-hex.com (by name)
library(vizoR)

palCook <- color_hex_palette_from_name("Cook")
palCook
#> [1] "#236e23" "#1b1b1b" "#d5881c" "#ef3f3f" "#e8e8e8"show_pal(palCook)Retrieving a color palette from colourlovers.com (by number)
palTerra <- colour_lovers_palette_from_number("292482/Terra")
palTerra
#> [1] "#E8DDCB" "#CDB380" "#036564" "#033649" "#031634"show_pal(palTerra)library(ggplot2)
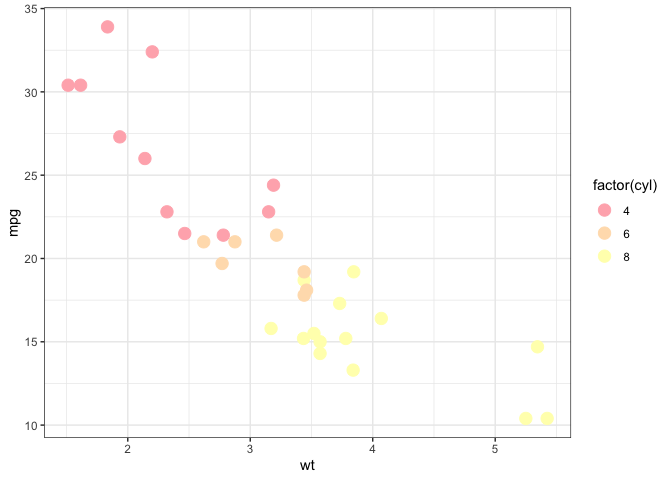
p <- ggplot(mtcars, aes(wt, mpg))
p + geom_point(size = 4, aes(colour = factor(cyl))) +
scale_color_manual(values = pal5361) +
theme_bw()library(patchwork) # devtools.install_github("thomasp85/patchwork")
p1 <- show_pal(cbp_pal(black = FALSE)(8))
p2 <- show_pal(cbp_pal(black = TRUE)(8))
p1 + p2 + patchwork::plot_layout(ncol = 1)p <- ggplot(mtcars, aes(wt, mpg))
p + geom_point(size = 4, aes(colour = factor(cyl))) +
scale_color_cbp(black = FALSE) +
theme_bw()dt <- generate_dataset_uniform(dataset_size = list(20,10, 15, 8),
min_x = list(0, 1, 3, 3),
max_x = list(3, 4, 5, 7),
seed = 13)
dplyr::glimpse(dt)
#> Observations: 53
#> Variables: 3
#> $ x <dbl> 2.13, 0.74, 1.17, 0.27, 2.89, 0.03, 1.72, 2.29, 2.62, 0.12…
#> $ y <dbl> 0.41, 1.64, 2.03, 1.58, 0.26, 1.86, 0.10, 1.38, 0.99, 1.90…
#> $ group <chr> "group1", "group1", "group1", "group1", "group1", "group1"…p <- ggplot(dt, aes(x, y))
p + geom_point(size = 4, aes(colour = group)) +
scale_color_cbp(black = FALSE) +
theme_bw()p <- ggplot(dt, aes(x, y))
p + geom_point(size = 4, aes(colour = group)) +
scale_color_cbp(black = FALSE) +
theme_elegant()p1 <- ggplot(dt, aes(x, y))
p1 + geom_point(size = 4, aes(colour = group)) +
scale_color_cbp(black = FALSE) +
theme_elegant_dark()


