Air Pollution in Delhi over the past 25 years using python, pandas, numpy,matplotlib and seaborn libraries.
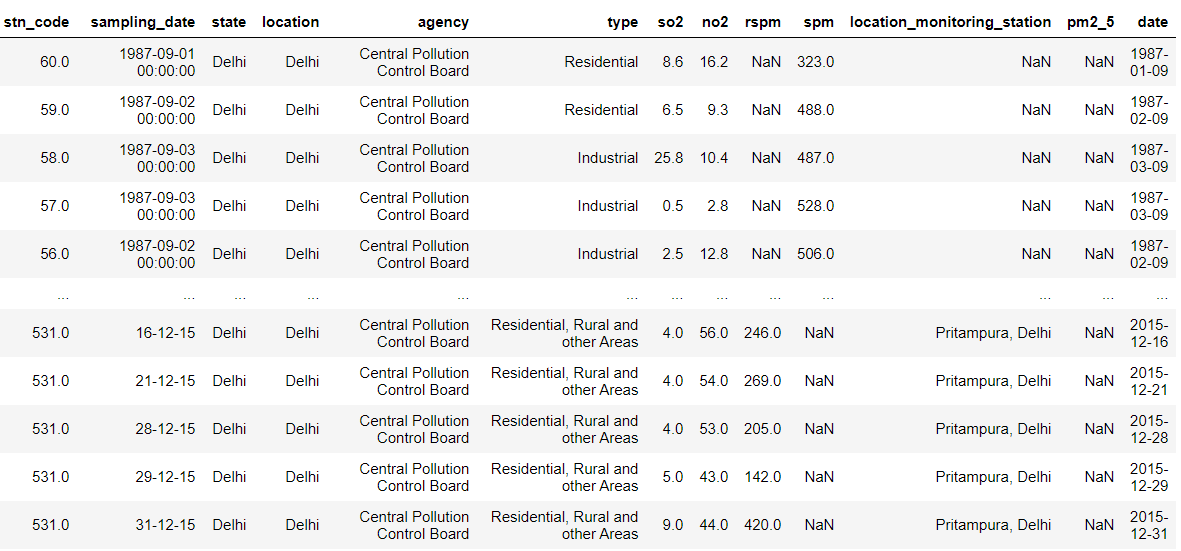
Involving data cleaning and data exploration.
The dataset is available at data.gov.in and I have also added the dataset file.
The project involves-
a) Data Cleaning
b) Data Processing
c) Data Visualization
For data visualization I use-
| a) scatter plot |
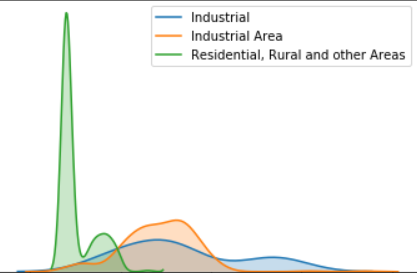
b) dist plot |
|---|---|
 |
 |
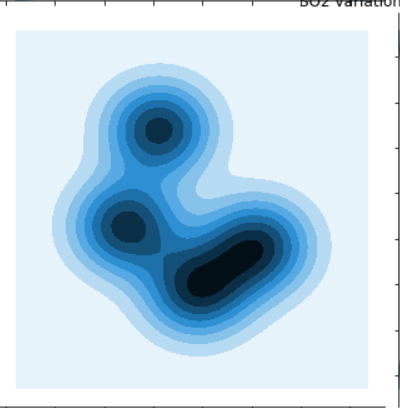
| c) kde plot |
d) dense plot |
|---|---|
 |
 |
| libra |
